The Weather, in Royston

Review of 2025

Drier and Sunnier

Fewer wet days

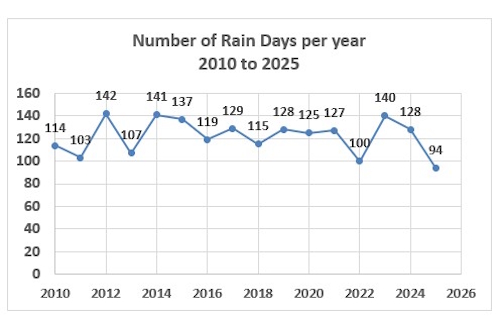
There was the lowest recorded number of rainy days in 2025 at 94 compared with 128 in 2024
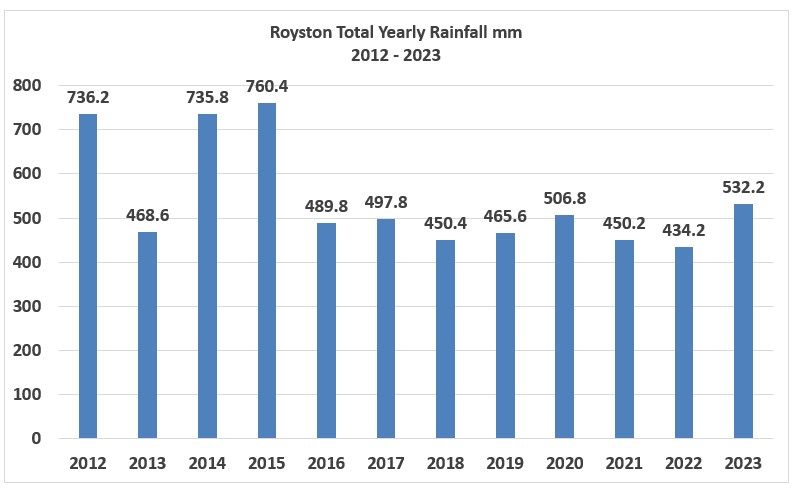
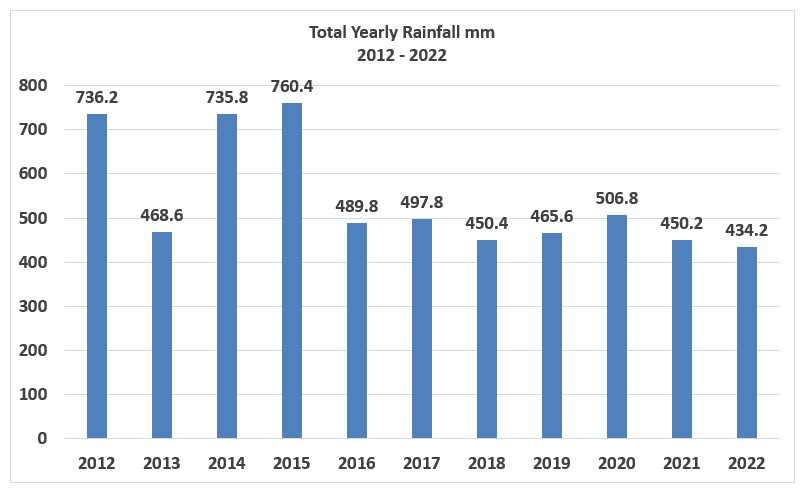
Rainfall down

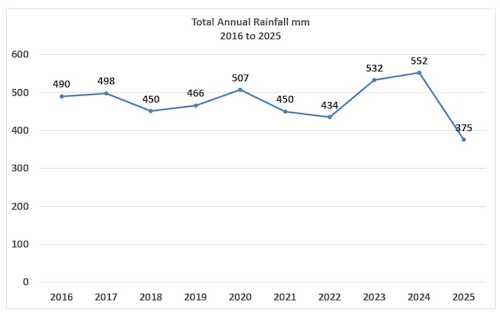
The total rainfall has gone from 552mm in 2024, the highest recorded since 2016 when the new Davis system was installed, to 375mm in 2025, the lowest recorded.

Minimum temperature up

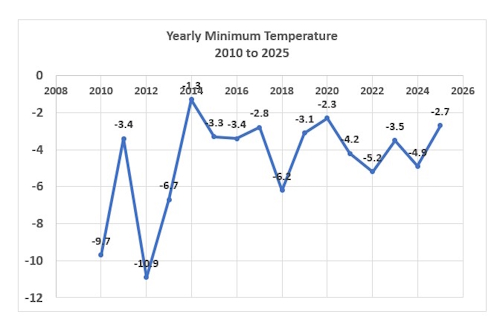
The annual minimum temperature for 2025 was warmer at -2.7C than the -4.9C for 2024.
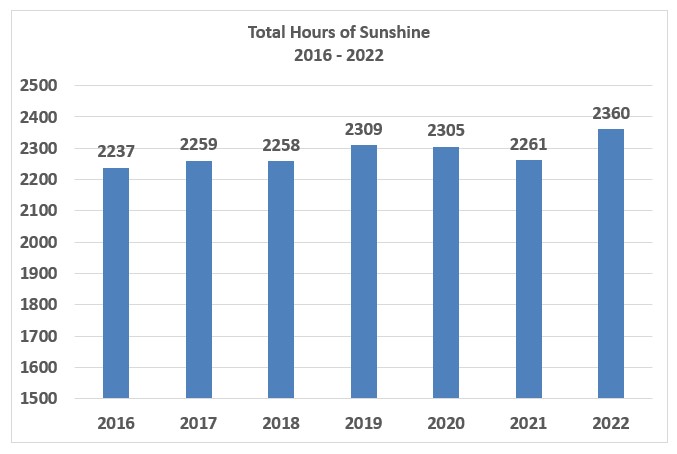
Sunshine up

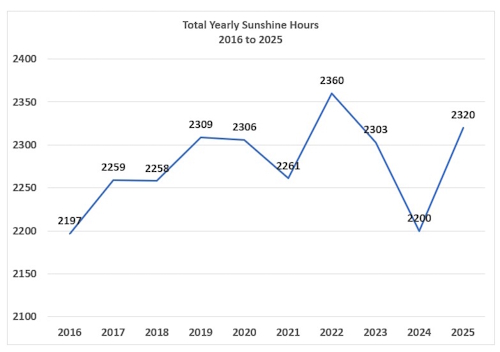
Sunshine hours are again on the up after a decline in 2024, increasing to 2320 in 2025


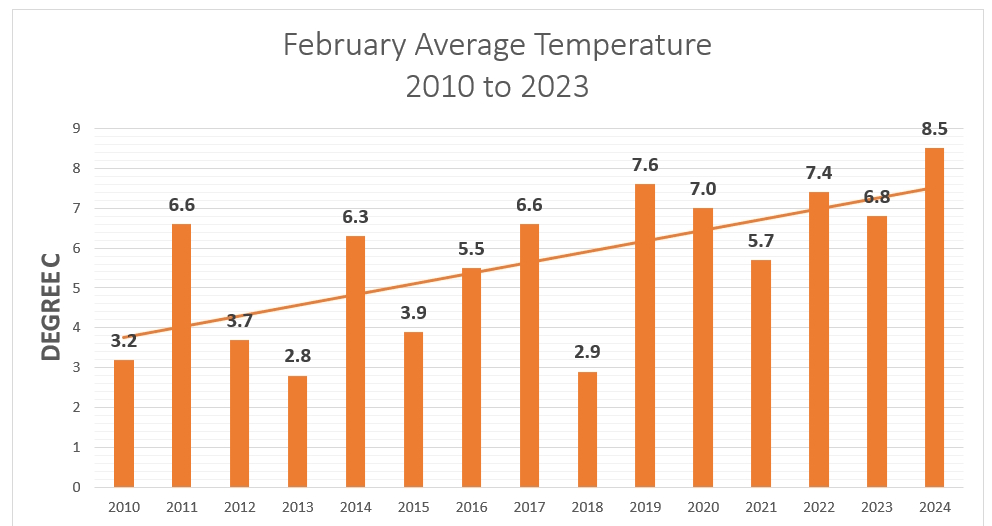
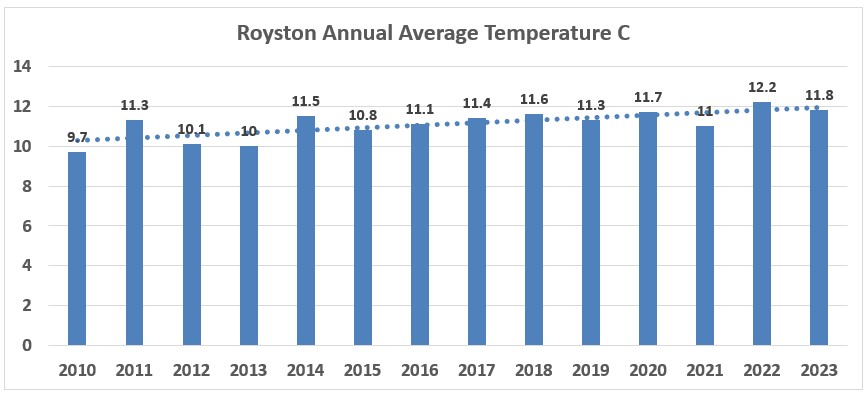
Annual average temperature up

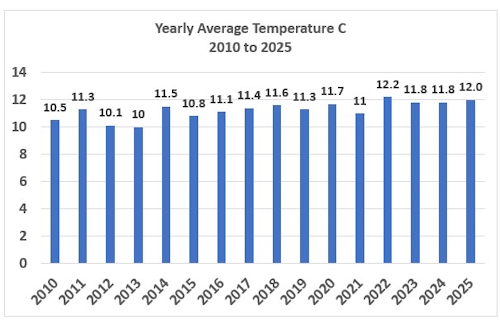
The average temperature for the whole of 2025 was 12.0C, slightly up on 2024 at 11.8C There is a clearly increasing trend in average temperature since 2010 when recording started in Sun Hill.
The Met Office has stated that 2025 is the hottest year on record in England at 10.94C, a figure that covers the range of temperature from the south coast to the Scottish border .

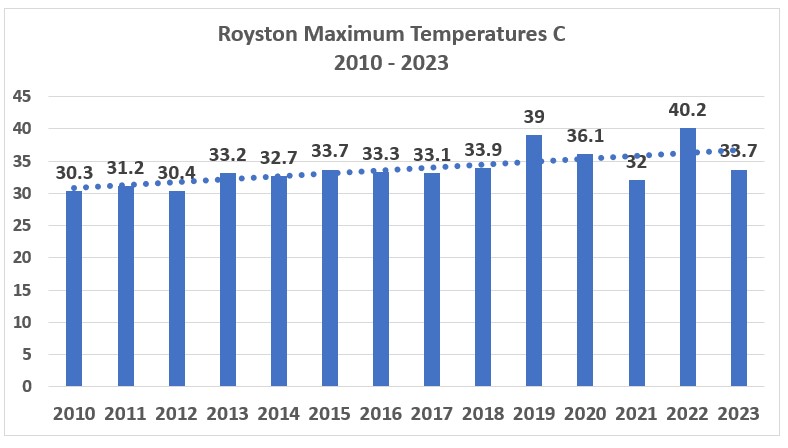
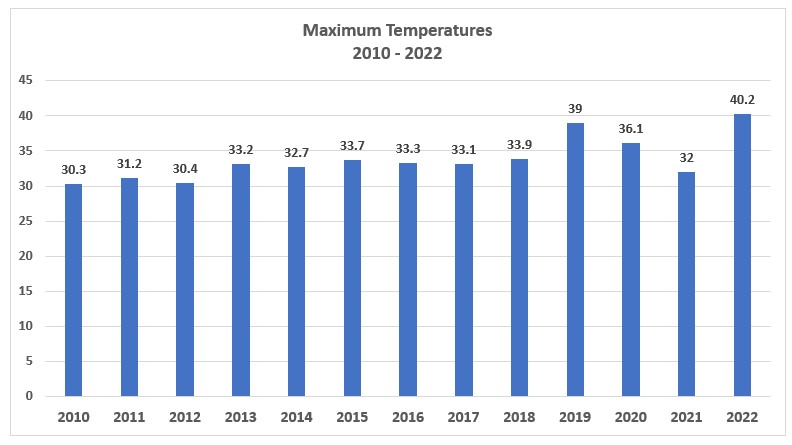
The maximum temperature for 2025 of 34.3 was marginally lower than the 34.7C for 2024.

Heatwaves

How many heatwaves have there been in Royston?

The Meteorological Society (MS) defines a heatwave as when the daily maximum temperature meets or exceeds a certain value for at least three consecutive days. The defining temperature for our area is 28C.
You can see the details at The Meteorological Society

The Sun Hill weather station has been recording data since the start of 2010. During this period there have been 31 heatwaves according to the MS definition.

The lower line shows the number of heatwaves for each year. For the first half of the graph there were a couple of years with no heatwave and the rest with one with the minimum span of three days. Things dramatically changed in 2018 with a record six heatwaves. Three of these were in July with two in June and one in August. July 2018 has also the highest average monthly temperature recorded at 21.1C. After 2018 there has been more than one heatwave for each year.

The upper line shows the number of days that were counted in a heatwave in each year. Pre-2018 all but one year the periods were for the minimum three days. Post 2018 the number of days have ben significantly higher with 2025 the third highest even though the year has not yet finished.

In which months do heatwaves occur?

As you would expect the heatwaves are confined to the summer months with July being the most frequent. Interestingly, all of the August heatwaves occurred in or after 2018

Review of 2024

Dark and Wet!

Highest temperature of the year

The maximum temperature for 2024 was marginally higher than 2023 at 34.7C but way below the maximum recorded of 40.2C

Average temperature for the year

The average temperature for the whole of 2024 was 11.8C, the same as 2023. There is a clearly increasing trend in average temperature since 2010 when recording started in Sun Hill. A noticiable increase due to global warming.

Total rainfall for the year

The total rainfall for 2024 was 552mm, the highest recorded since 2016 when the new Davis system was installed. The trend is upwards.

Total sunshine for the year

The total sunshine for 2024 was significantly down on 2023 at 2200 hours and is the second lowest since the new Davis system was installed.

Stop the Blockage

Cunning plan to stop rain gauge blocking

The previous blog told of a weeks outage of rain data. Once my brain had started functioning after Covid I rang PRODATA Weather Systems in Littleport Cambs who had sold me the Davis Vantage Pro 2 Plus I use. See below.

They sold me a replacement collector which has a much more secure filter. It arrived next and it is now in place - a very simple job to switch the two.

Fingers crossed that this has solved the problem

Rain What Rain

Lost a bit of rain data

The hurricane struck Royston just as Covid struck me. I have only just felt steady enough to go up and clear the rain collector which was full to the brim. Apologies for no rain measures for the most dramatic week of the year

February 2024

Wet and Warmish

.
In February 2024 the rainfall was 72mm, the highest since 2014 which was 76mm

.
.
An average temperature of 8.5 may not seem high but it is the highest I’ve recorded in Sun Hill

Review of 2023

Little changes mean a lot

Average annual changes in temperature are not very large but we all now know the impact of these small changes on the world.
At 11.8C the average temperature for 2023 is not the highest seen but the dotted line shows the upward trend in Royston since 2010

.
.
.
The highest temperature seen in Royston was 40.2C in 2022. The value for 2023 is 33.7C but the trendline is upwards.

.
.
.
The rainfall of 532.2mm in 2023 was the highest seen since 2015

Review of 2022

2022 - a real record-breaker!

• Hottest year in Sun Hill records (and ever in met office records)
• Highest ever temperature
• Most hours of sunshine since recorder installed 7 years ago
• Coldest December in last 10 years
• Driest year in last 10 years

Record temperature for Royston

40.2C at 14:41 Tuesday July 19th

Another new record high temperature for Royston.

The July 2019 record of 39.0C beaten at 17:49 on July 18th 2022 the highest temperature measured in Royston was 39.2C.
It was a hot night following the record breaking day with the temperature not dropping below 23.6C - another record.