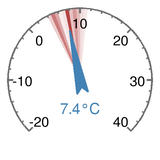
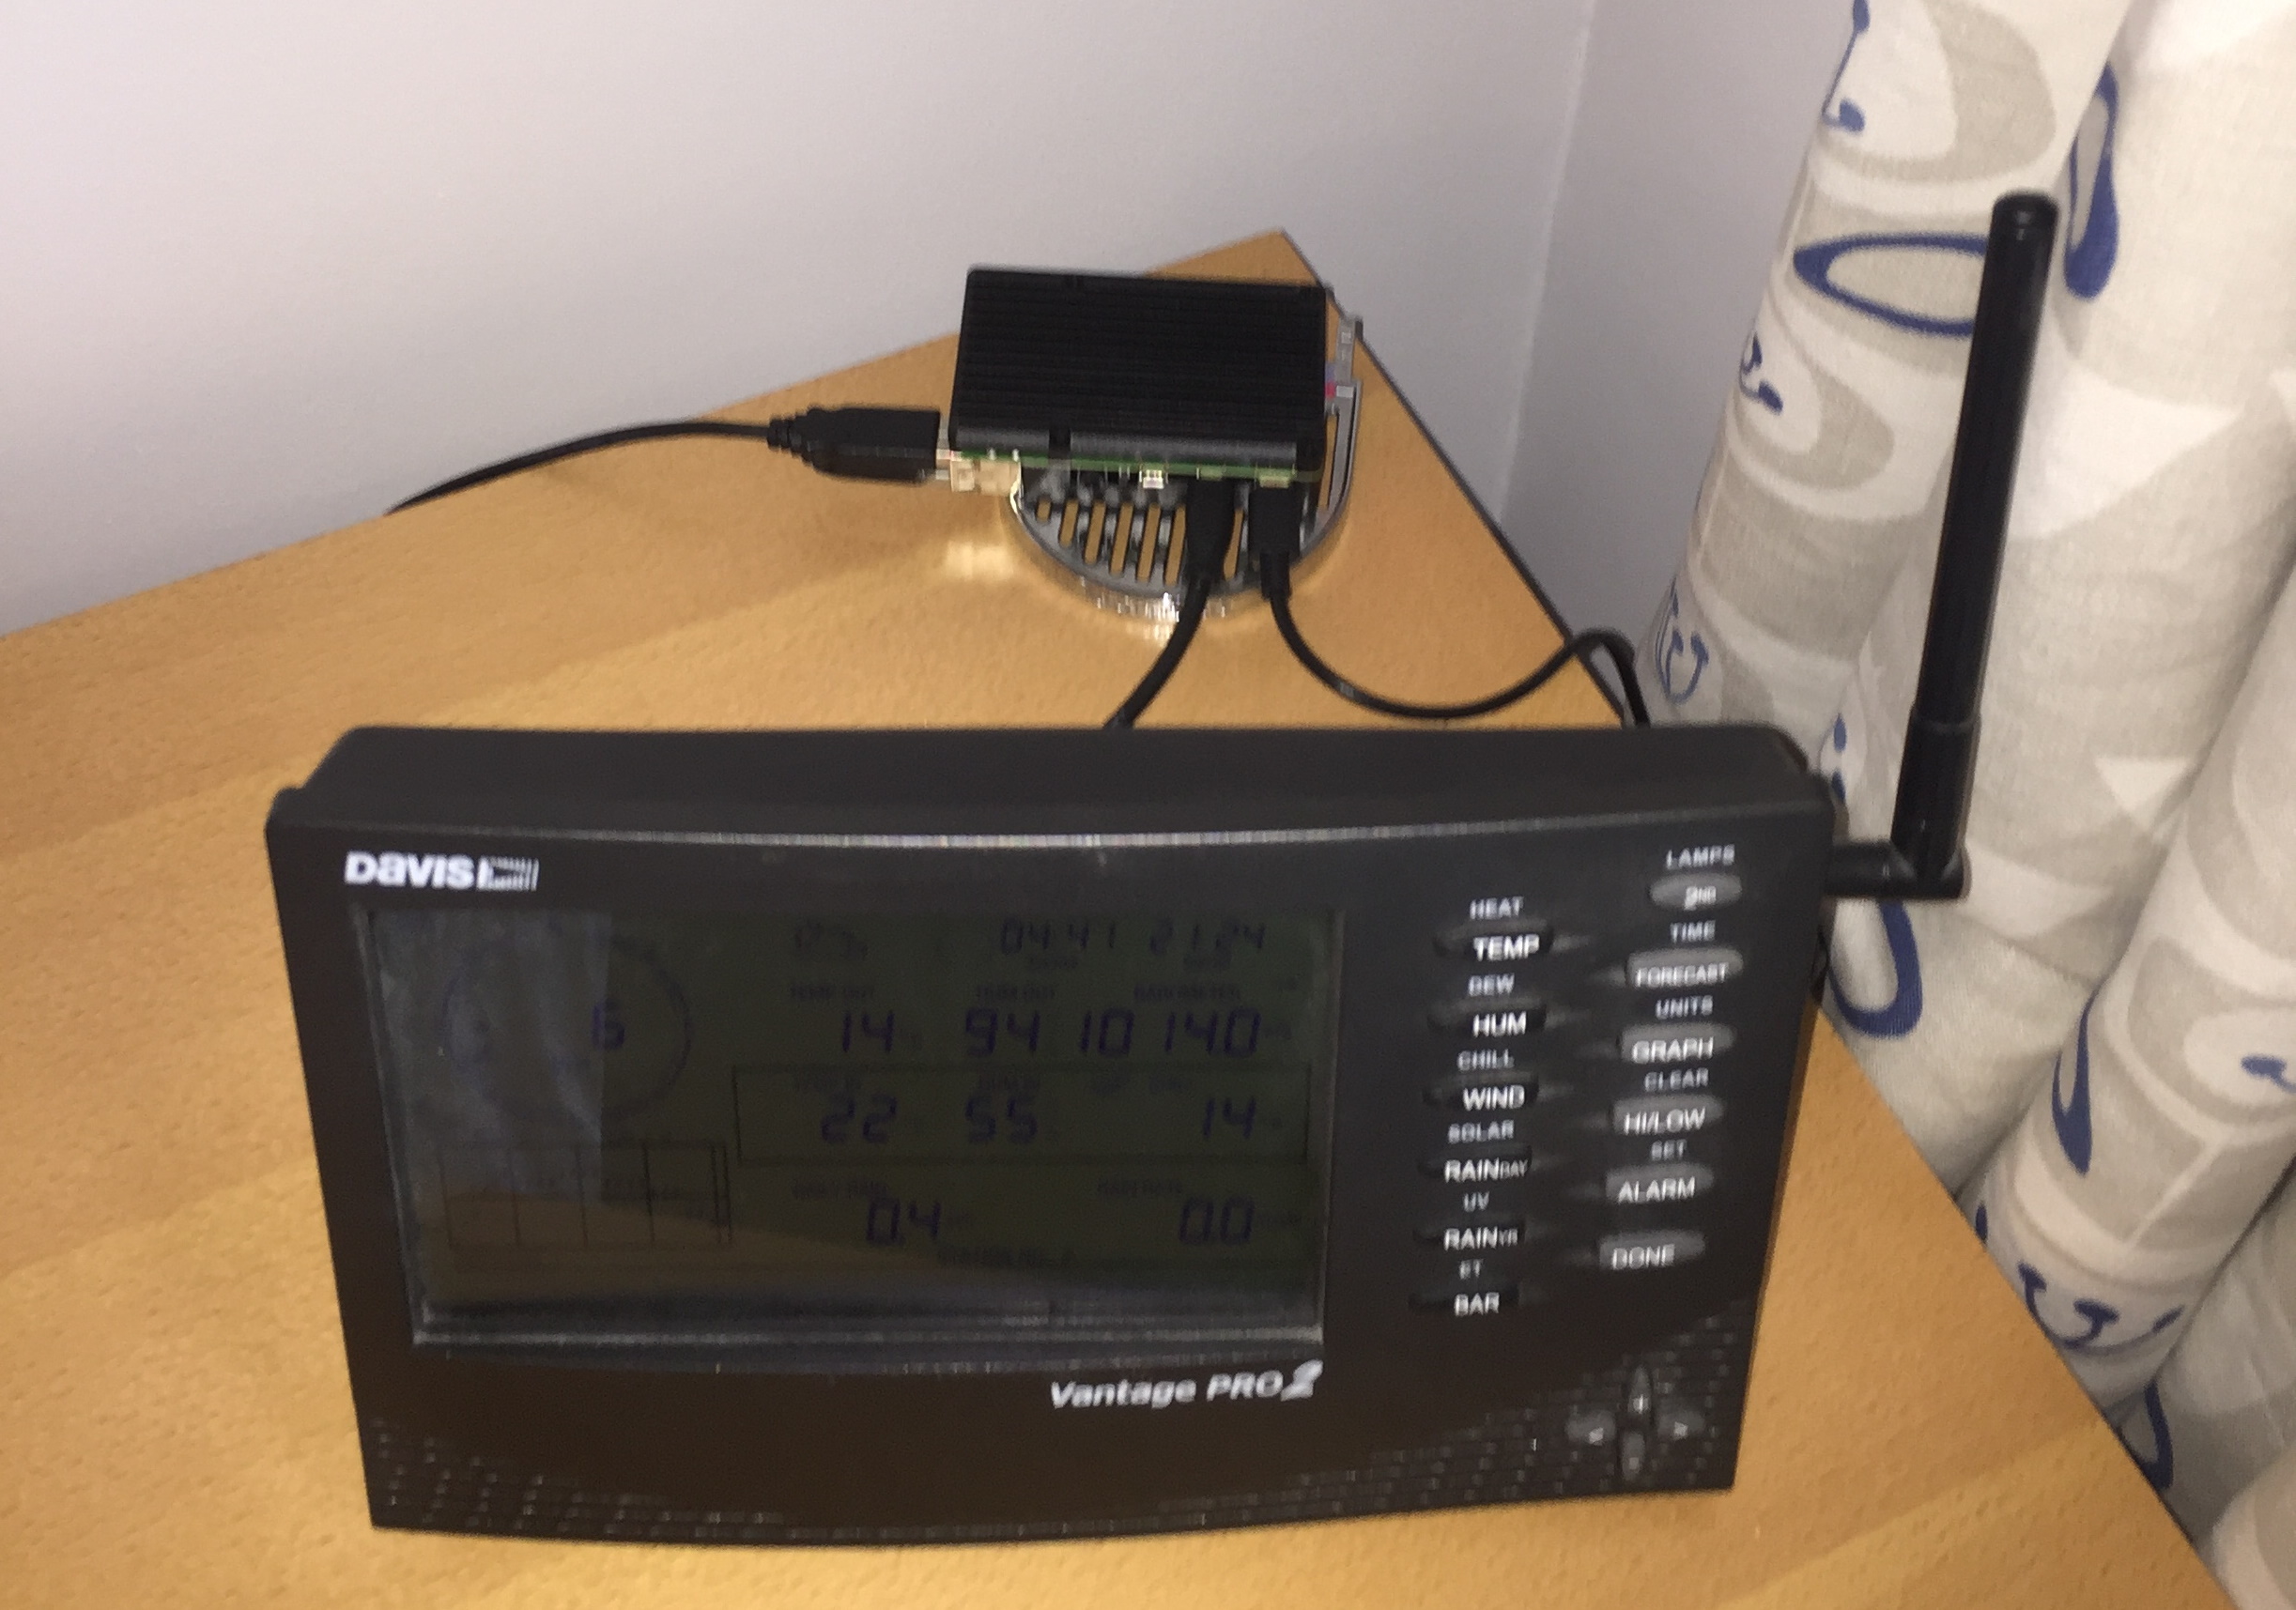
Outside Temperature
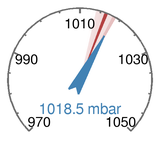
Barometric Pressure
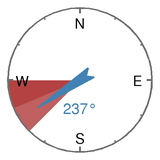
Wind Direction
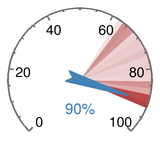
Outside Humidity
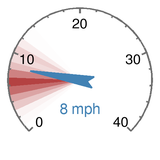
Wind Speed
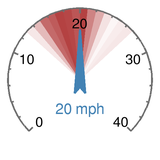
Gust Speed
| First light / Sunrise | 04:34 / 05:16 |
| Sunset / Last light | 20:37 / 21:19 |
| Altitude: | 80 meters |
| Station uptime: | 230 days, 17 hours, 19 minutes |
| Server uptime: | 230 days, 17 hours, 19 minutes |
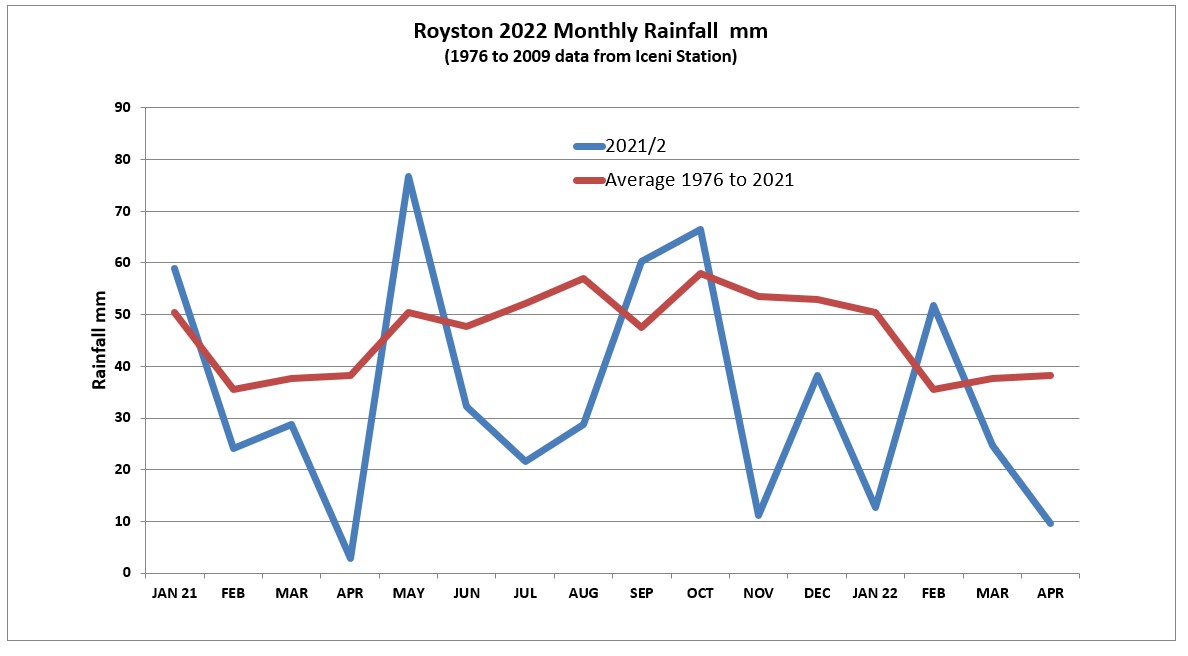
Rain is back after 25 days Ryzc, 5th May 2022
On May 4th there was 7.8mm of rain after 25 dry days. This almost as much as fell in the whole of April - 9.9mm
By the end of April 2022 Royston was down by 50mm compared with an average year's rainfall total for January to April, a whole month's rain.
Yet another mystery downpour explainedRyzc, 21st October 2021
A mystery downpour for 21/10/2021 is really delayed rain from 20/10/2020. Removing rubbish from the rain collector released a rush of rainwater. So 20th and 21st should read 23.4 and 3.4 mm (not 11.4 and 15.4). the weather station was given a good wash and brush-up.
June 21 dryish and warmish Ryzc, June 25th 2021
Despite the cold and wet of the last week the month, as a whole June was above the recent average for temperature at 17.1C and below average rainfall despite one day of downpour. The rainfall was 32.2mm,about two-thirds of an average June.
Raspberry Pi goes to bed Ryzc, June 25th 2021
The latest power outage which brought down the Raspberry Pi on June 18th 2021 has again had the electrician scratching his head - see entry below for November 2015 - so again I have had to move the Pi and weather station console to a bedroom on a different ring main. A shame as the console is a quick source of the current weather status when it is in the study downstairs.
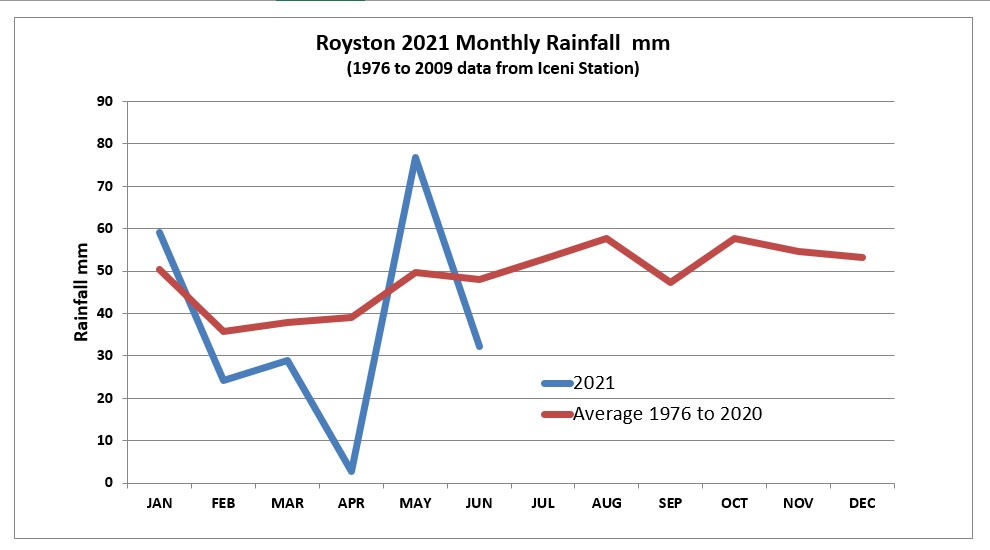
April 2021 Cold and Dry Ryzc, May 5th 2021
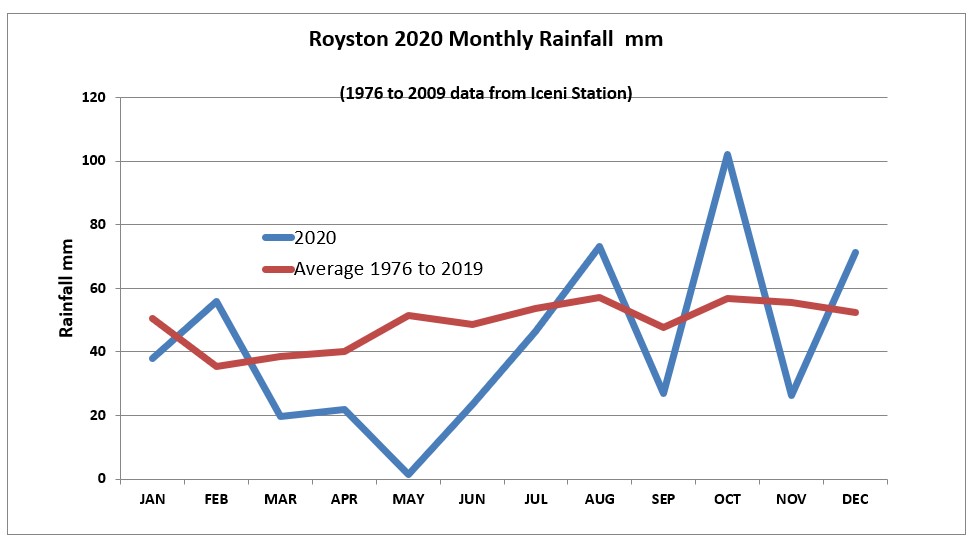
There was virtually no rain in April, the third month in a row of low rain as the graph below shows.
According to the Met Office April 2021 had the lowest average minimum temperatures for April in the UK since 1922. April in Royston was not quite the coldest but getting there and certainly the coldest I have recorded.
How cold has it been this February? Ryzc, February 15th 2021
The lowest temperature this month was -4.2C. Feb 2018 was -6.2C and Feb 2012 was -10.9C (the lowest temperature I have recorded). What has made it feel especially cold in 2021 is that we had 6 days consecutively with and average below zero whereas 2012 only had 3 days in total. 2012 was the record with 10 days averaging below zero. The History page Click here will show you all of the averages.
Review of 2020 Ryzc, January 3rd 2021
The Met Office summary for the year was "2020 has been a year of extremes with the wettest February on record, the sunniest spring, a heatwave in the summer and a day in October breaking rainfall records."
For Royston rain it was a game of two halves with three times as much rain in the second half of the year than in the first. October was by far the highest for that month in my data.
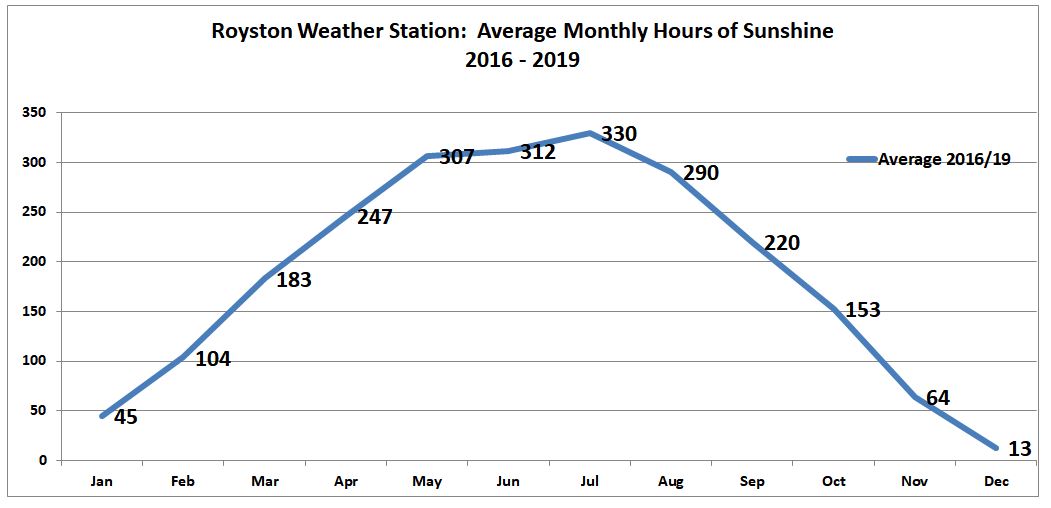
Sunshine was average but from a small amount of data.
2020 was the hottest year I've measured in terms of the average temperature for the whole year but we are talking of small differences 11.7 for 2020 compared with 11.6 for 2018. The maximum temperature was 36.1C compared with 39.0 for 2019.
Outage on December 31st Ryzc, January 2nd 2021
There was an outage for a day when upgrade failed. A complete rebuild of the system was needed. We have a daily backup so no data was lost and it was simple to re-instate the control files.Review of November Ryzc, December 7th 2020
After the downpour in October the rain went down to below average again at 26.4 mm for December. The month was fairly mild with an average daily temperature of 9.1C and a sunshine level of 73 hours which just squeaks in as the highest sunshine level for a November that I've recorded. iv>Weather Station Repair Ryzc, November 22nd 2020
I'd been peering at the anemometer (spinny bit that measures the wind speed) and it looked like it needed a good gust of wind to start it rotating rather than the mildest summer breeze that used to get it going. After 5 years of non-stop spinning the bearings had worn out. Prodata in Ely where I bought the original kit got a new bearing unit to me the next day and I have just fitted it with help from my neighbour David who gave much technical support and also helped with the ladder. There are some funny readings around 11:00 when we were testing the kit and the 6mm rain at the time are a result of jogging the rain gauge.
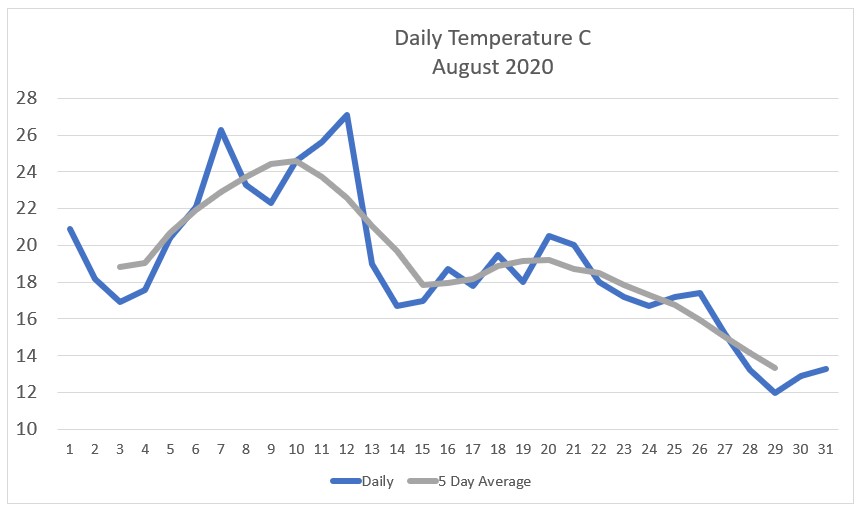
<Revue of August Ryzc, September 6th 2020
An above average amount of rain in August. The month got colder and wetter as it went on giving the lowest sunshine levels I've recorded.
System Outage Ryzc, June 6th 2020
We had an outage between 03:20 on Sunday 21st of June and 11:20 on Monday 22nd of June. One again the downstairs ring main retired injured. Graham of Graham's Electricks (very highly recommended) tracked it down to a socket in the kitchen into which some water had got. New socket and we are back in business. Sorry for any inconvenience.
Another mystery downpour explained Ryzc, June 18th 2020
As on 28/07/19 (see below) there was a mystery downpour. Not a flash flood but removing the blockage from the rain collector released a rush of rainwater blocked in the rain collector.It was given its annual wash and brush-up and should be good for another year.
A Perfect May? Ryzc, June 3 2020
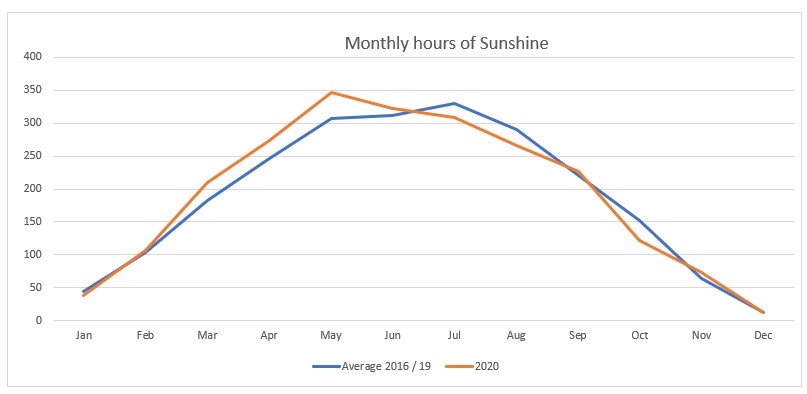
May was dry and sunny. The Met Office has announced that May 2020 was the sunniest month on record - not just the sunniest May but the sunniest of any month of the year. I recorded 347 hours of sunshine.
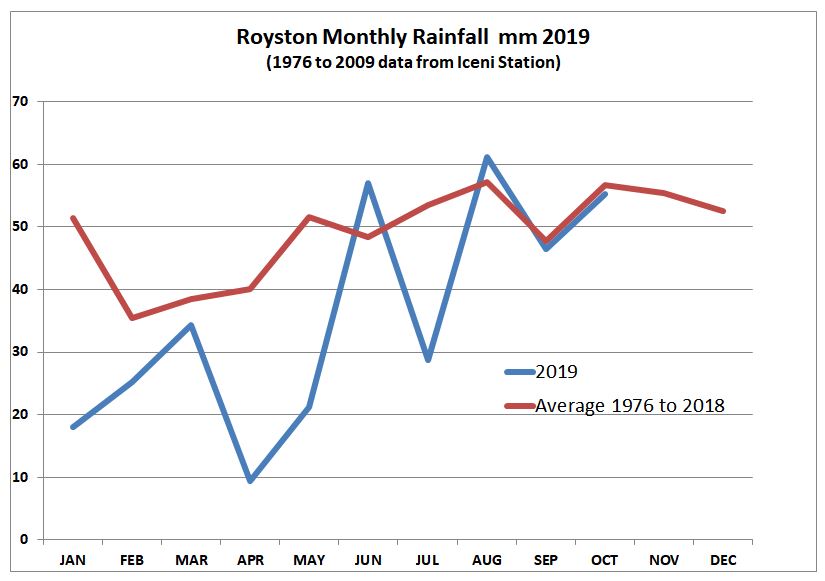
Rain was almost nonexistent in May, 1.6mm. The graph below shows the downward trend in 2020. We are now down over a month and a half of rain for the first five months of 2020 compared with the historic average.
Extreme Weather Ryzc, March 10 2020
We have had some extreme weather in the last couple of months and I would like to highlight new highs in rainfall and wind.
Lots of Rain
The Met Office confirmed that February 2020 was the highest on record. It wasn't a record for Royston (see the History page) but was well above the average for the last 45 years in Royston. If you look down this page to the December 2019 graph you will see that most of 2019 was below average but caught up with a big splash at the end of the year.
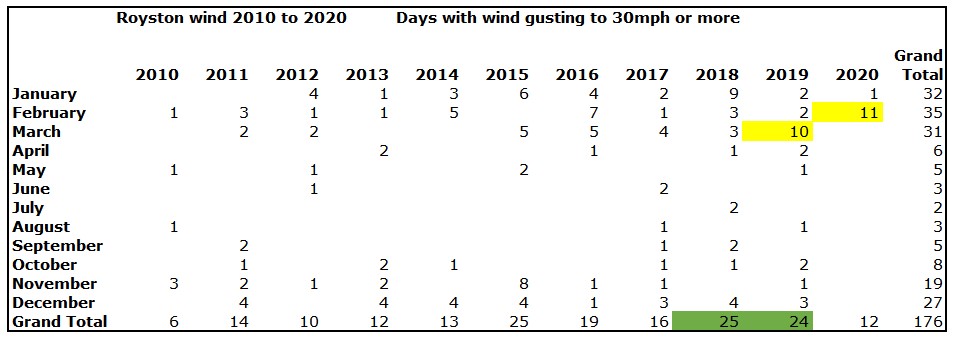
High winds
Besides getting repairs for my wind damaged fence I've been pondering the number of occasions we have had high wind gusts. Lately the wind has exceeded 30mph on many days and I commented about it to my son (the tech guru behind the Sun Hill weather station) who came up with the data I have summarised below. I normally show the weather data as a graph but in this instance I'm going to try with a data table so please bear with me.
The table shows the number of days in each month from 2010 to 2020 where the gust wind speed exceeded 30mph. So the numbers highlighted in yellow show that the gust speed was high for 11 days in Feb 2020 and 10 days in March 2019 - the highest figures I have recorded in Sun Hill. The green highlights show the totals for the latest two years are two of the three highest.
Review of the decade Ryzc, January 2nd 2020
I've now been monitoring Royston weather for a decade, starting in February 2010. Below are some comments on the highs and lows of the decade.
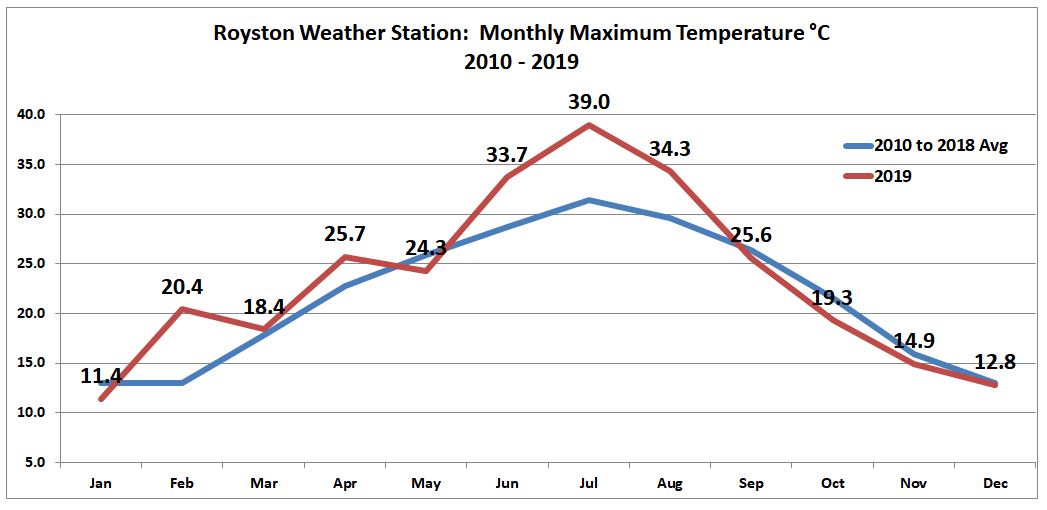
June, July and August saw the highest temperatures of the decade with the 39.0 recorded in August being most likely the highest temperature ever measured in Royston.
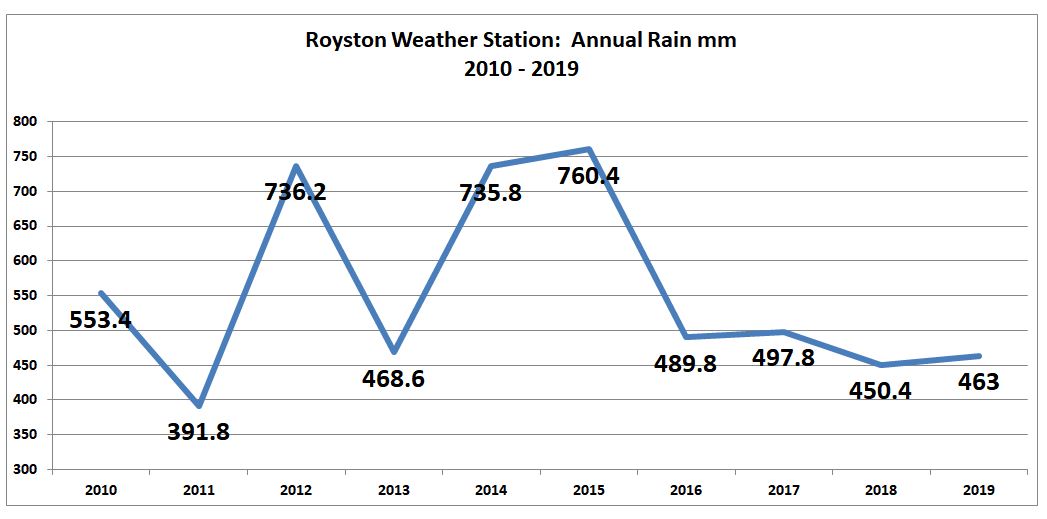
In terms of total rain for the year 2019 was one of the lowest of the decade. An averagely average year has around 500mm of rain but if there is any kind of downpour, for example June 2015 with 153mm, then the year turns out at around 750mm
Not strictly a review of the decade as I have only had the means to measure sunshine for four years, but I thought I would introduce some of this data. We've just finished December with the shortest day of the year and an average of 25 minutes sun per day. We can look forward to building up to July with 10hrs 39mins per day.
December Rain Ryzc, January 2nd 2020
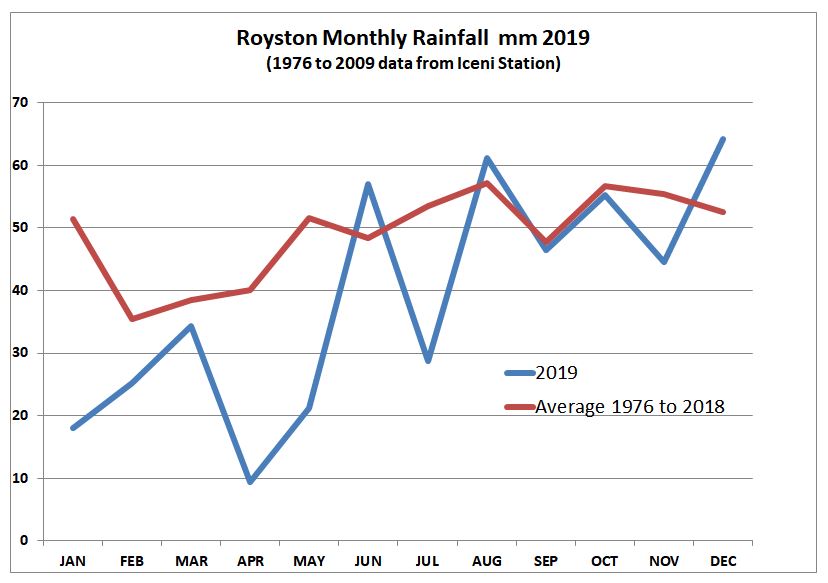
2019 ended in a big splash with a much higher than average December rainfall of 64mm and 15 rainy days
System Outage Ryzc, November 4th 2019
We had an outage between roughly 7pm on Friday 1st of November and 6pm on Sunday 3rd November. I only noticed it when I got back from a weekend away and wanted to see how much rain there had been while I was away. Those of you familiar with this blog will remember that I have an ongoing problem with an UPS (Uninteruptable Power Supply) which is supposed to protect the Raspberry Pi against a mains failure but yet again it is the UPS that has failed leaving the Pi dead. Plugging the Pi directly into the mains sorted the problem and the UPS is heading for the bin. Sorry for any inconvenience.
Mystery downpour explained Ryzc, July 28th 2019
On the 28th of July at around 8.30am there was a sudden downpour of 10.6mm of rain. Not a flash flood but removing the blockage from the rain collector released a rush of rainwater (see also November 29 last year below). During the dry spell dust had gathered and got baked solid in the rain measurer funnel. The collector was given its annual wash and brush-up and should be good for a while.
What is a Record Temperature? Ryzc, July 26th 2019
I've been asked why is the temperature of 39.0C in Royston on July 25th not being considered for a national record when the reading of 38.7C from the Cambridge Botanical Gardens is being looked at as a record?
The ratings are mainly to do with the siting of a station such as how high off the ground it is and whether there are trees or buildings nearby. Rain gauges are ideally sited 30cm from the ground, wind speed should be monitored 10m above the ground and instruments should have been calibrated within the last 10 years. These conditions give a measure of standardisation and comparability.
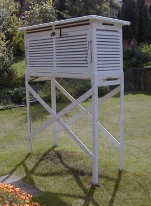
The main reasons for including or excluding a weather station boil down to its location. If you look below on this page to my blog of September 25th 2017 where I talk about getting back data for Royston I mention that the Iceni station was a "proper" one in that it was contained in a Stevenson Screen and I show a picture. A number of criteria for judging weather stations can be found on the Met Office website Click here
I'm happy that my reading of 39.0C is a reasonably accurate measure of the temperature of my station located 10m off the ground and is comparable to previous measures taken in the last 10 years in the same location.
Record Royston Temperature Ryzc, July 25th 2019
Hottest day of the year at 39.0C and a new record for Royston. The previous high that I can find reported for Royston on the old Iceni station is 36.4C on August 10th 2003
Review of June 2019 Ryzc, July 1st 2019
How Hot?
June had the hottest day of the year at 33.7C and was just short of the record breaking July 2018 figure of 33.9C
How much rain?
There was a lot of rain in June, 57.0mm, which is the higest amount since April 2018 but we are still low on the year.
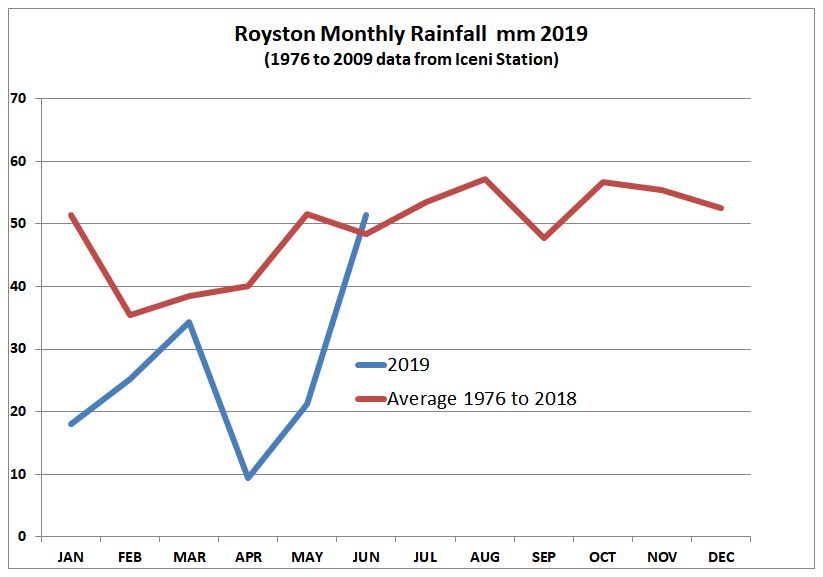
Cumulatively for the year we are still way below average.

What's happening to the rain Ryzc, May 9th 2019
After four months of very low rain we had almost as much rain on May 8th as in the whole of April.
The graph below shows that apart from March the first months in 2019 have been below average at a time of year when rainfall is at its lowest. However May seems to be making up for it.
Royston Weather review 2018 Ryzc, February 17th 2019
Are we getting hotter?
Royston has been getting warmer over the last few years.
Data from the Sun Hill weather station shows that the average temperature since 2010 has shown an upward trend with 2018 being the hottest.
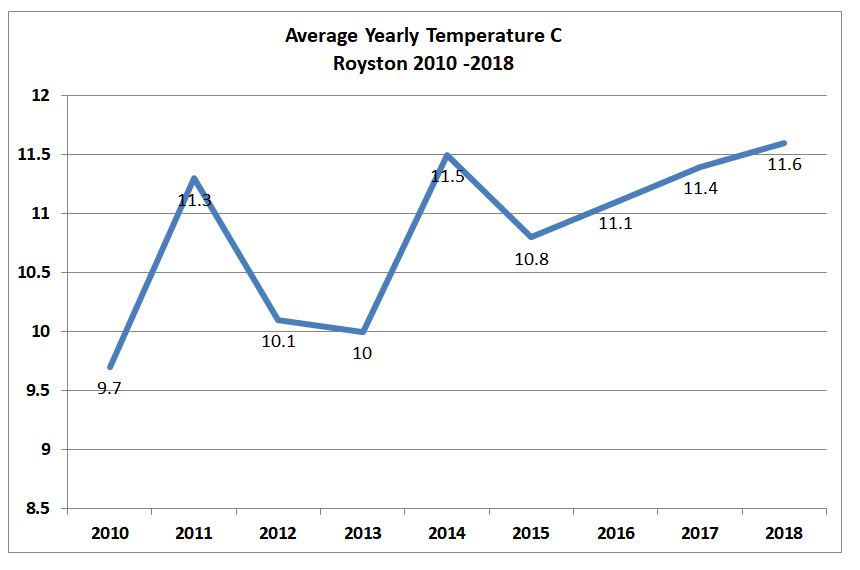
Globally the temperature is rising. The 2018 average global temperature was the 4th hottest since 1880, placing it behind 2016 2017 and 2015 The Guardian
For the UK I cannot find any UK ranking for the whole of 2018. The press speculated through the summer that 2018 may be the hottest summer ever but had to settle for 2018 was the joint hottest summer tying with 1976 2003 and 2006 since records began in 1910. BBC News
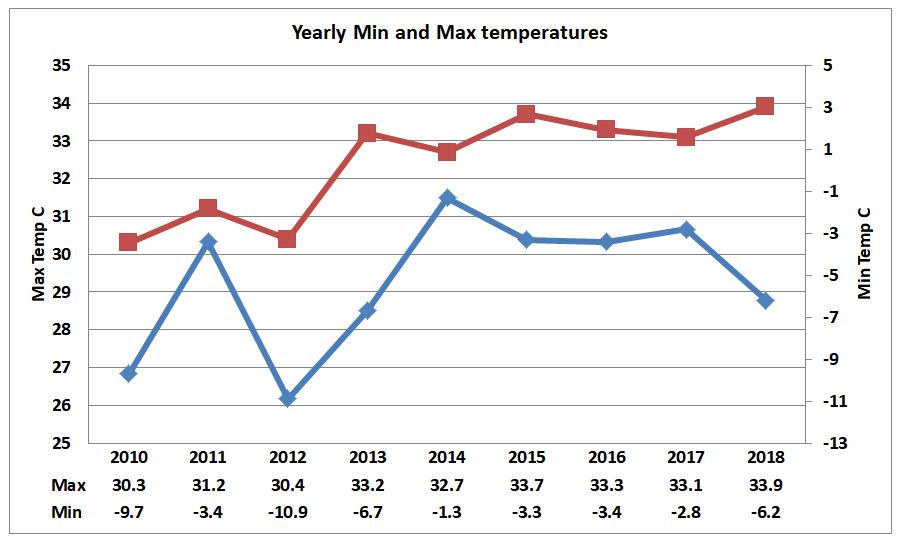
Is the temperature getting more extreme?
The maximum Royston temperature has been at a high level for the past six years whereas the minimum is more variable.
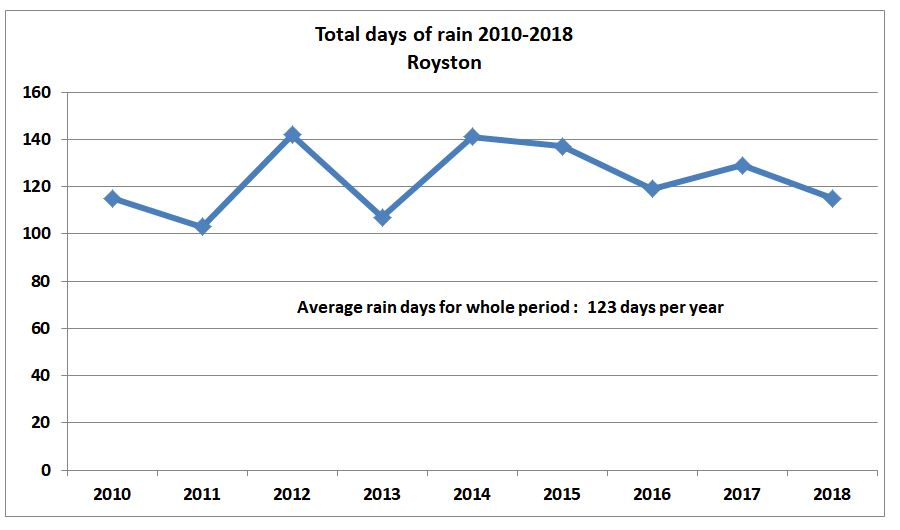
Is Royston getting wetter?
Despite the record breaking 57 day drought during 2018 (see reports below) the whole year was very near the eleven year average of 123 days of rain in a year.
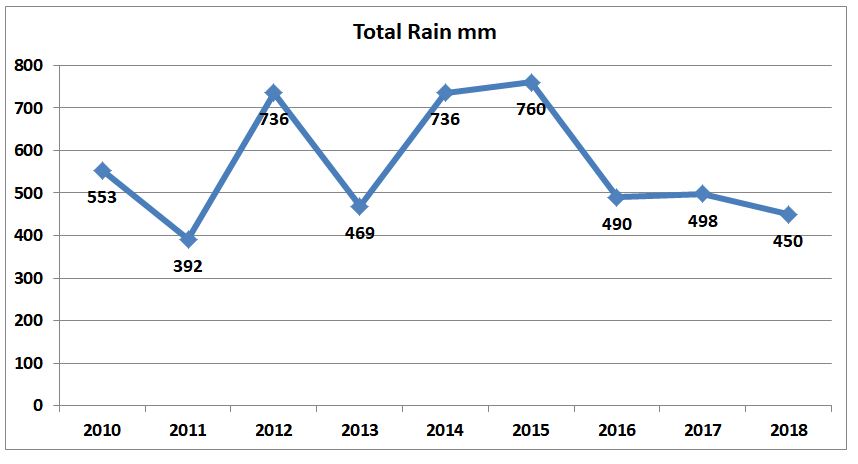
How much rain?
Compared with the number of days of rain the amount of rain does vary more widely. 2018 was at the lower end of rainfall levels
How can I find out more?
Most of these graphs and observations have been derived from the History tab on the website. If you only use a mobile to look at the website you may not know it exists. To get the full detail from the site view from a PC or a tablet in landscape mode.
Rain Gauge blockage cleared Ryzc, November 29th 2018
Most of the rain shown on November 29th belongs to the 28th so the daily figures for those dates will be wrong but the week and month total will be correct. It looks like some very fine seeds blew in to the collector, past the grid which keeps the leaves out and in to the hole feeding the measuring cups
September Review - Average! Ryzc, October 1st 2018
The mean temperature was in the middle of the range we would expect at 15.1C although the low temperature was lower than recent at 4.7C. Rain was average.
August Review - Back to Normal Ryzc, September 2nd 2018
If you look at the History tab you will see that August was neaer to normal than July, although above average for temperature. 10 days of rain is about average for the month
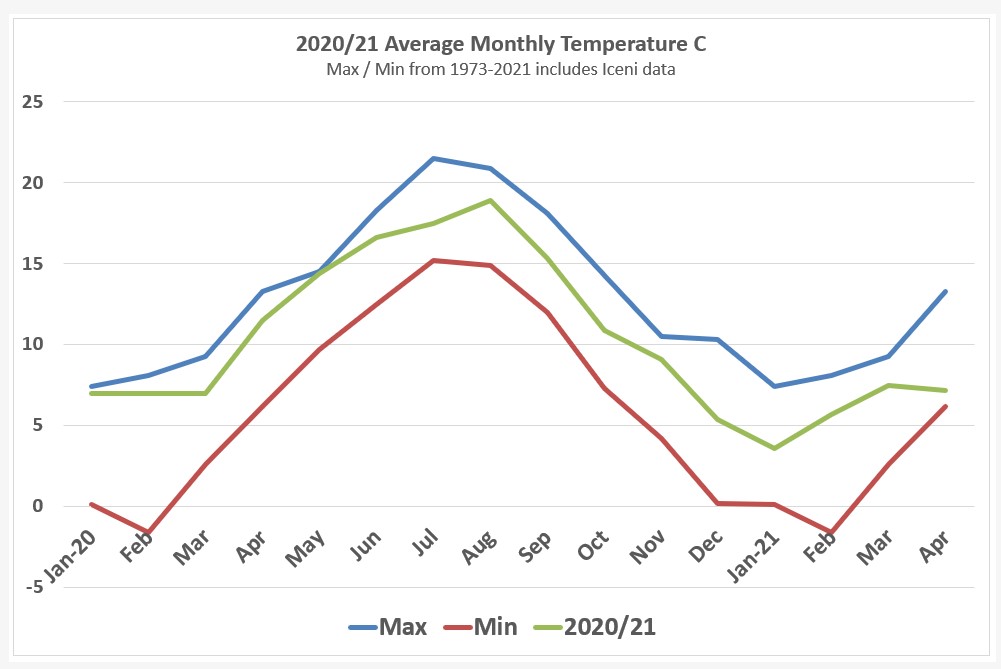
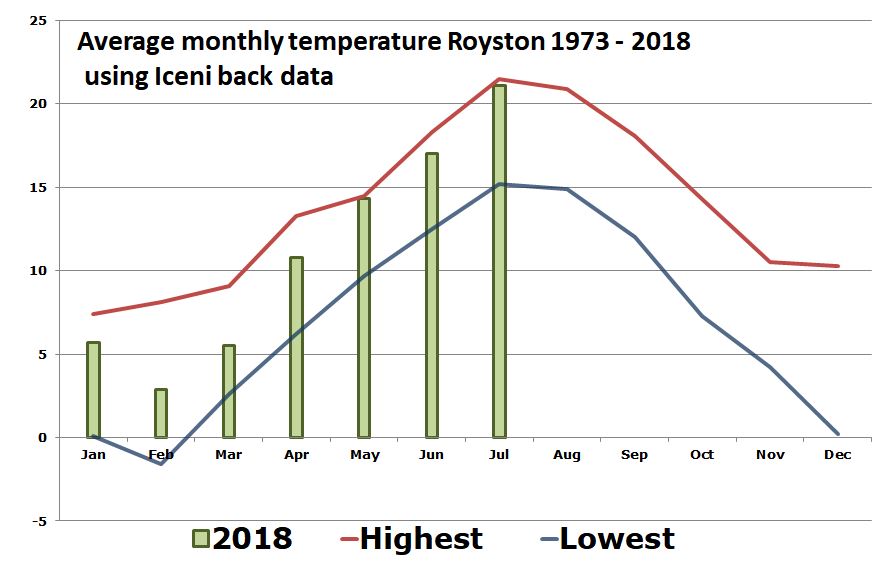
A hot July Ryzc, August 4th 2018
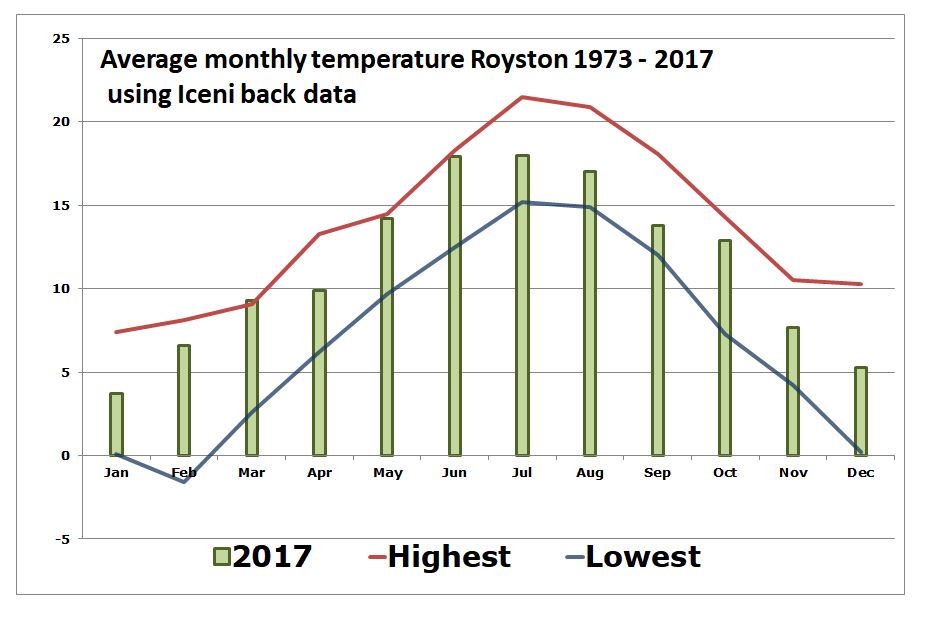
The graph below shows the average monthy temperatures in Royston since 1973 - incorporating Iceni data for 1973 to 2009. July 2018 was one of the hottest in the last 45 years with an average temperature of 21.1C, the highest was 21.5C
After 57 days ... RAIN Ryzc, 27 July 2018
The drought since May 30th 2018, 57 days without rain in Royston has come to a dramatic end. At 17:05 there was a flash of lightning, a clap of thunder, a 30mph gust of wind and then hail and rain. 5.3mm in 5 minutes at which my weather station console announced that is is "Raining Cats and Dogs"
Every day is a hotter Hottest day of the year. Four this week Ryzc, 27 July 2018
Monday, Wednesday, Thursday and now Friday July 27th is the hottest day of the year at 33.9C. This is also the hottest temperature I've recorded on my weather station
Slight problem with the website Ryzc, 25 July 2018
The eagle eyed of you weather watchers will have noticed that over the past few months the website has occasionally been a bit hesitant to load. This was because of problems in transmitting the web page updates from the Raspberry Pi which does all the hard work, to my website. The update happens every five minutes but lately the update has taken longer than five minutes, tripping up the next update which was trying to start. This effectively bunged up the works. The solution was to upgrade the hosting package where the site is kept. Unfortunately this went slightly awry (as upgrades are known to do) and the Pi was unable to transmit anything at all to the website. After a lot of head scratching, manual reading and support calls the typing error that caused the problem was spotted and corrected. Fingers crossed we are now OK. Apologies for any inconvenience caused at this crucial time of drought and high temperatures.
Hottest day of the Year Ryzc, 26 June 2018
After two months of 29.9C we have finally hit 30.0C on June 26th. June is the hottest month with an average temperature of 17.0C
May's weather? Ryzc, 4 June 2018
WARM.The average temperature for May was 14.3 nudging on the hottest for 45 years. You can see the numbers on the History page.
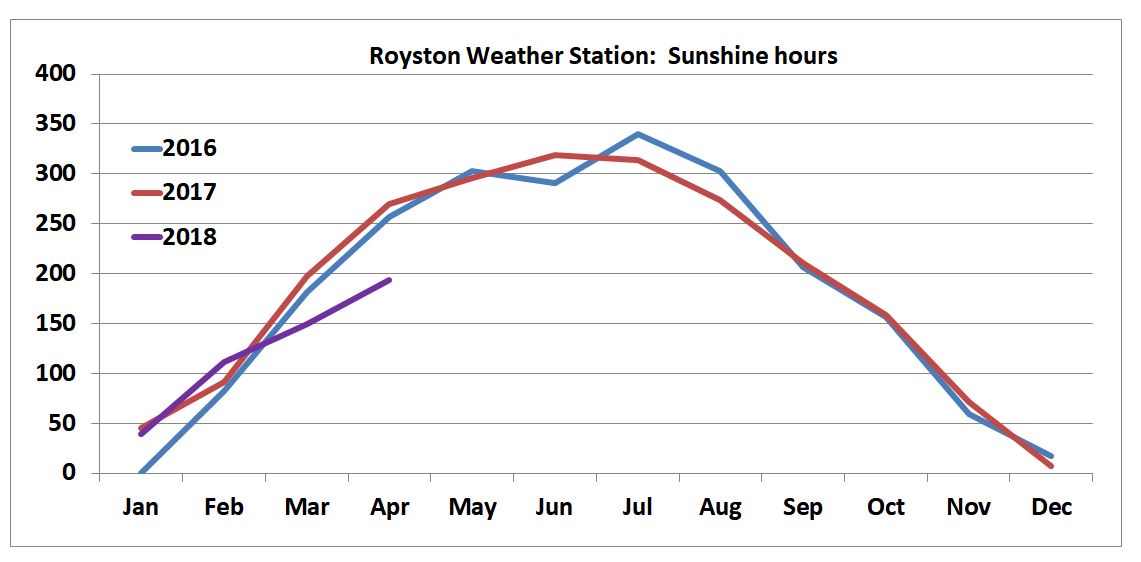
SUNNY.From the limited sunshine data I have May was bright - certainly better a lot than April. You can see the numbers on the History page.
Hottest May Bank Holiday Ryzc, 7 May 2018
In line with other places in Britain we have had a scorching bank holiday with a maximum temperature of 29.6C
How has the weather been so far this year? Ryzc, 7 May 2018
DARK. As the graph shows there were 70 fewer sunshine hours in April this year than last year. You can see the numbers on the History page.
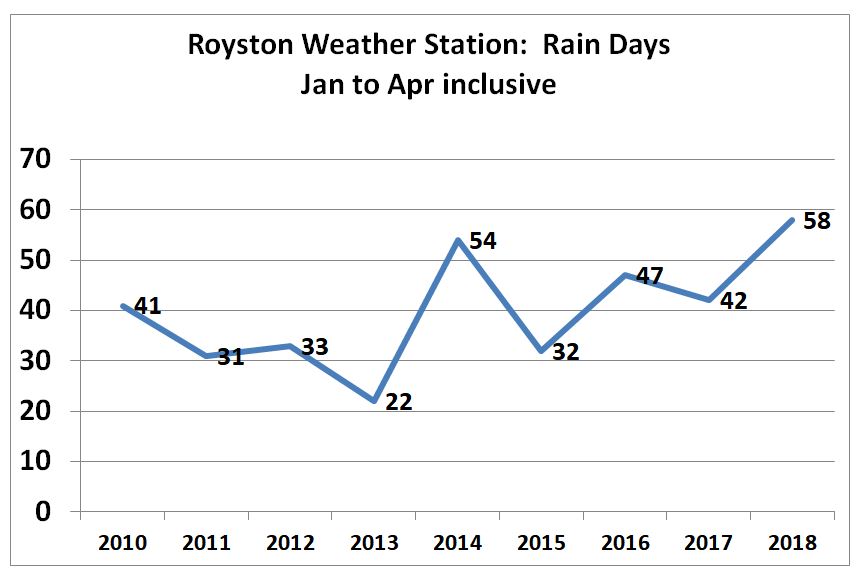
WET. THe graph below shows that for Jan to Apr there were 58 days when it rained - the highest I've recorded. That works out at rain every other day. You can see the numbers on the History page.
Update: How do we measure snow? Ryzc, 4 March 2018
The 4.4mm of rain measured on March 3rd was the snow from this week melting
How do we measure snow? Ryzc, February 28 2018
The short answer is When it's melted. There are attachments that will keep the rain collector warm and melt the snow as it falls. These cost $200+ and need a mains cable out to the weather station. So snow in our system is collected untill it thaws and measured as it melts, so there might be a day or two delay
Getting colder Ryzc, February 23 2018
Today - Feb 23 - we have had the coldest night at -3.0C since January 2016
See item below to look at more weather extremes
How to find Highest and Lowest values Ryzc, January 14th 2018
Go to the "Stats" tab to see Highs and Lows for today, this week this month and this year
Go to the "History" tab to see values for individual months since the Sun Hill Weather Station started
Starting to get brighter Ryzc, January 14th 2018
Since I wrote on the 14th we have had sun for 10 of the 14 days up to today. Last December there were only 12 minutes of sun in Moscow.
Not much sun at this time of year Ryzc, January 14th 2018
Buried at the bottom of the pages that make up 'The Weather' tab (Last 24 hours, This week, This Month, This Year) are measures of how much sunshine we've had. I'm looking at the graph at the bottom of the 'Last 24 hours' page and it confirms that there has been no sunshine at all today (14 Jan 2018). On the 'This week' page you can see that there has been only two hours of sunshine in the last week, most of it on January 7th. The 'This month' page shows that there have been fourteen days in the last month with no sunshine. So it has officially been gloomy.
Review of 2017 Ryzc, January 4th 2018
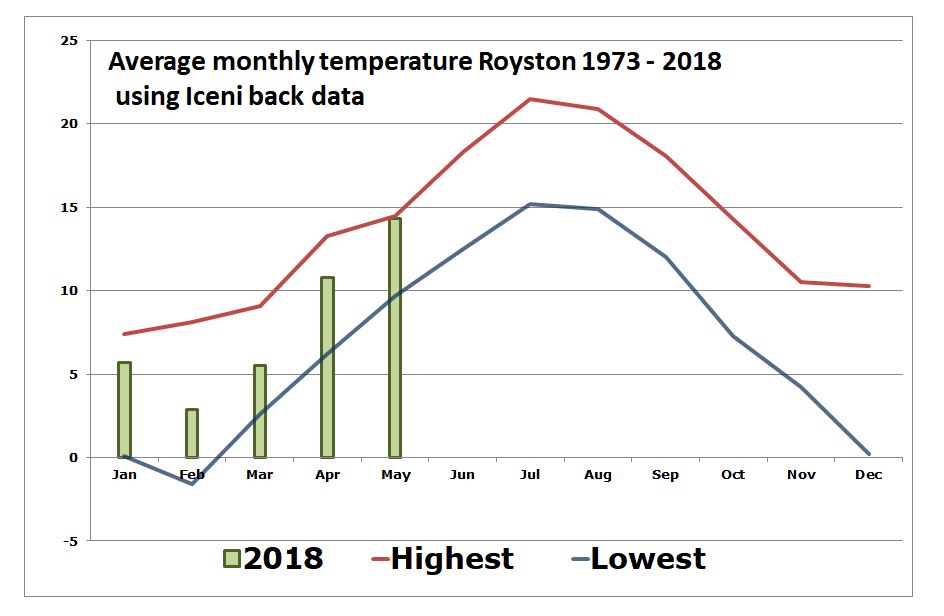
The graph below shows the average monthy temperatures in Royston since 1973 - incorporating Iceni data for 1973 to 2009 - see article below. In the first half of 2017 we had average temperatures for three of the months verging on the highest for 43 years. September was on the cold side but October was warm.
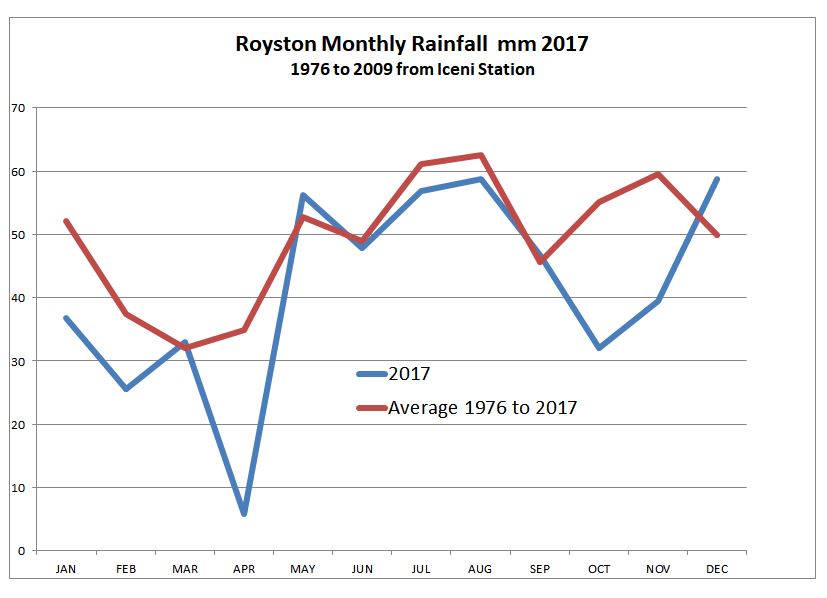
Comparing monthly rainfall with average shows that April had exceptionally low rain and the autumn was also a bit lower. The annual total was 498mm compared with an average over the years of 590mm.
Historic weather data from the Royston (Iceni) Weather Station Ryzc, September 25th 2017
For a number of years weather data was collected just outside Royston using a "proper" weatherstation - a "Stephenson screen", a box with louvred panels on legs, in an open area. Data was collected and displayed from May 1972 to July 2013. The information was displayed in graphical and numerical form and is still available on the internet at Royston Iceni Site I have added this data to the analysis of monthly average temperatures in the above article
More rain gauge problems Ryzc, August 11th 2017
It seems that the rain collector gets blocked quite easily - 5 months since the last stoppage it has happened again. The drip feed showed again - like the image under the March 1 entry below. Then a total stoppage just before one of the wettest days this year, August 9th. I was away so could only fix it on August 10 - poke a narrow wooden skewer into the exit hole and all is let loose so the 18.2mm showing on Aug 10 really belongs in Aug 9. The week and month total will be correct. The manual says clean the collector several times a year so I'm planning every 4 months. Watch this space
No Sun Hill Weather Data Ryzc, June 19th 2017
Apologies to Sun Hill weather data followers for the outage between 02:05 on Saturday June 17th to 18:40 on Sunday June 18th. This was due to a hot and bothered router (see next item on record temperature) deciding that an internet connection was just too much trouble. When I returned on the Sunday night the usual turn it off and on again did the trick. A friend is now on standby to repeat this technical task should it happen again whilst I am away.
Record June Temperature Ryzc, June 19th 2017
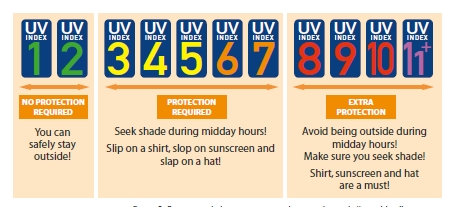
Whilst I only have 8 years of Sun Hill data June 18 was a record high for June of 32.8C - see the History tab. The month is also shaping up to be the highest average temperature as was May 2017. The UV factor topped 8 over the weekend - see below for an explanation of the implications of this high value
Occam's Razor Ryzc, March 1st 2017
William of Ockham, a Franciscan friar who studied logic in the 14th century, is known for principle called Occam's razor: If there are several proposed explanations for an occurrence the simplest one is usually the best.
What has this got to do with weather stations? Eagle eyed followers of the Sun Hill Weather Station have commented on the rainfall pattern pictured below.
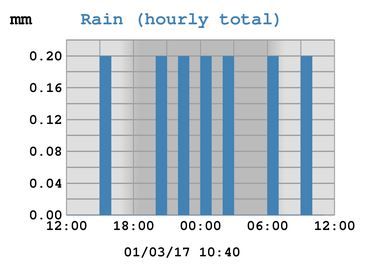
I came up with convoluted explanations to do with fog, condensation and melting ice. Last night it all came to a head when I was out running and the heavens opened. How much rain? I wondered. None said the station. But all night a steady drip of 0.2mm the smallest measurable amount of rain. So this morning it was time for the overdue service of the station. The rain cone still had quite a lot of .2s of rain as the hole was blocked with a paste of roof tile dust which greatly constricted the water flow. After a wash and brush up and change of back-up battery we are back in business and waiting to see what happens with the next rain. So the simplest explanation, barely considered, proved to be the answer. And those that RTFM would know that a rain funnel clean is recommended every four months or so.
Is this a Record? Ryzc, February 23rd 2017
There have been two weather records in four days - see below - Maybe rain will be next
Record breaking gust Ryzc, February 23rd 2017
13:46 We have just had a gust of 54mph which breaks the 2010 record of 43mph by a long way. Forecast for the area is gusting to 60mph all afternoon - watch this website
Hottest February day Ryzc, February 20th 2017
The temperature reached 16.9C on February 20th, the hottest February day in the Sun Hill database. Look at the History page on the website - Average Monthly Values where a monthly figures are summarised
Not a tornado but a good blast of wind Ryzc, November 18th 2016
Yesterday there was a tornado in Wales with winds up to 94mph. Nothing like that here but we did have a quick gust of 38mph which is in the region of our greatest ever gust of 43mph - See Stats page . The blast of wind was accompanied by a downpour. See "This week" or "This month" pages.
New Daylight features added Ryzc, November 14th 2016
The hours of daylight information has been expanded to give an estimate of the length of twilight each day. Previously Sunrise and Sunset was given. Now First Light and Last Light are given to show the periods before sunrise and after sunset when light can be seen in the sky.
Technically these are measures of Civil Twilight. Definitions of civil twilight and nautical twilight can be found at Time and Date
Is it getting hotter in Royston? Ryzc, November 14th 2016
It has just been on the news that 2016 is the hottest year on record. The Royston weather station has now been recording information for just short of seven years, so whilst I can't comment on global warming in Royston there have been some interesting variations.
I quite often look at the History page on the website - Average Monthly Values where a monthly summary is given for various measures. These are colour coded to show how they vary but to get a much better view of the variation a graph helps.
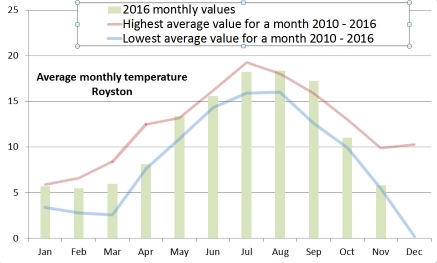
The graph shows the average temperature for each month in 2016 plus the highest and lowest recorded for each month.
May, August and September set new record monthly highs with June and July also near the top of the range.
If you would like to see more of this type of commentary or have any suggestions for alternative presentations please get in touch by clicking here. Feedback.
Hours of Sunshine now being reported Ryzc, February 14th 2016
On the week and month tabs, down near the bottom are now tables giving the hours of sunshine per day - thanks to Nick for adding the calculations to do this.
Sunshine hours are calculated using this service: radiationhours.py.
How to interpret the new radiation measures from the Sun Hill weather station Ryzc, February 14th 2016
Radiation
The new Vantage Pro weather station reports radiation as (Watts per square metre). This is the amount of solar heat hitting the earth where the weather station is located. At Earths average distance from the Sun (about 150 million kilometres), the average intensity of solar energy reaching the top of the atmosphere directly facing the Sun is about 1360 watts per square meter.
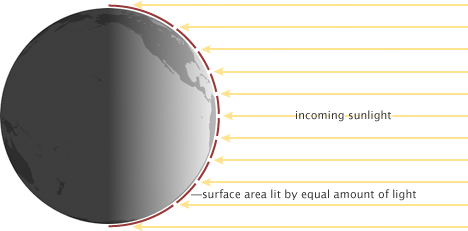
Energy from sunlight is not spread evenly over Earth. One hemisphere is always dark, receiving no solar radiation at all. On the daylight side, only the point directly under the Sun receives full-intensity solar radiation. From the equator to the poles, the Suns rays meet Earth at smaller and smaller angles, and the light gets spread over larger and larger surface areas (red lines)
How do we know when it is sunny?
According to World Meteorological Office if solar radiation exceeds 120 Watts per square metre then it is deemed to be sunny. So if the graph shows more than 120 it is sunny in Royston.
Ultraviolet light (UV)
UV is the main component of light that gives you sunburn. The Vantage Pro reports an index value in line with the WHO guidance on sun protection.
Backdata cleaned Ryzc, February 10th 2016
The rain data that was spuriously generated by the old weather station has now been removed.
New weather station in use Ryzc, January 27th 2016
The new Davis Vantage Pro 2 has now been erected into its long term home and is now contributing data to this site. Solar radiation and UV strength is now being reported although this will take a bit of time to build up. When I get a minute some of the test data from the start of the year will be transferred.
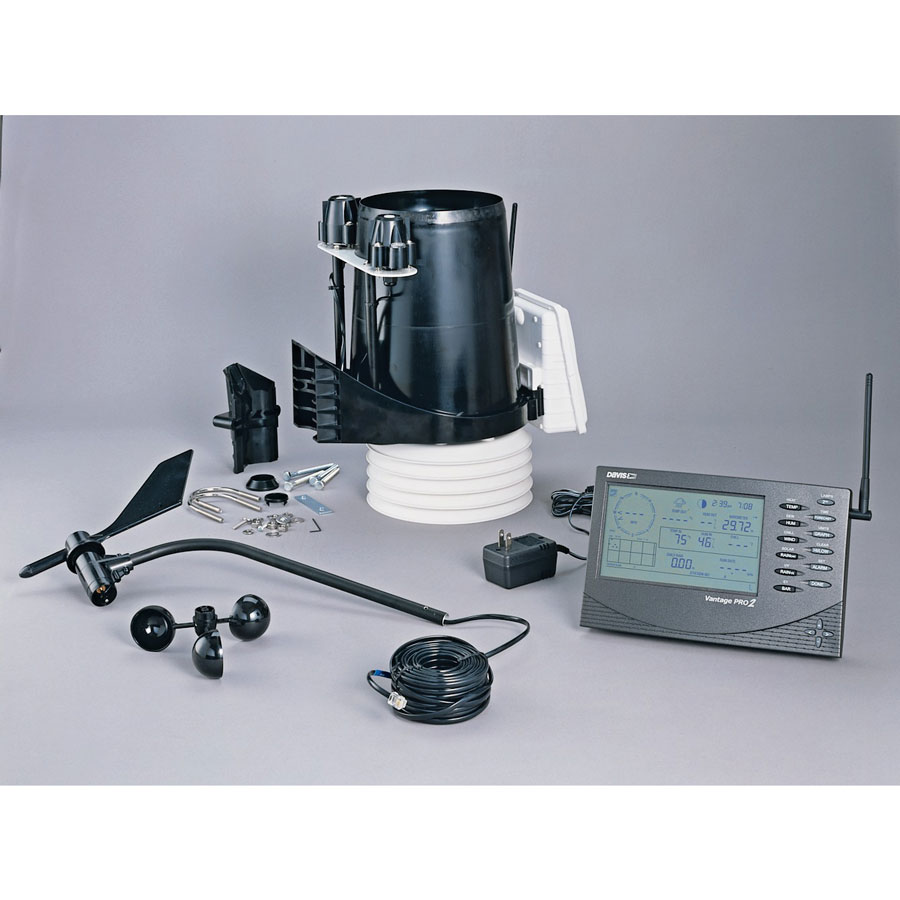
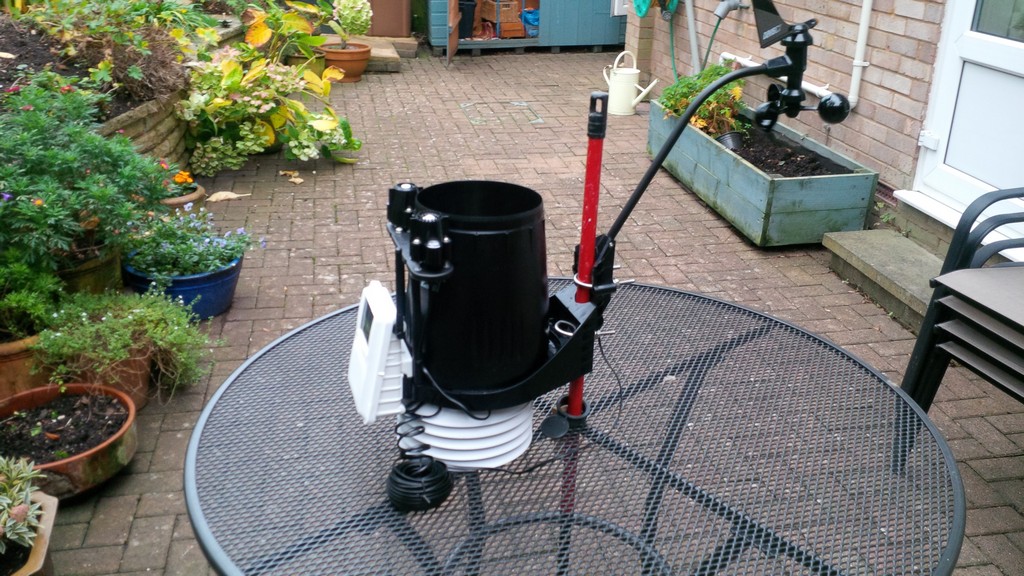
New Weather Station! Ryzc, December 17th 2015
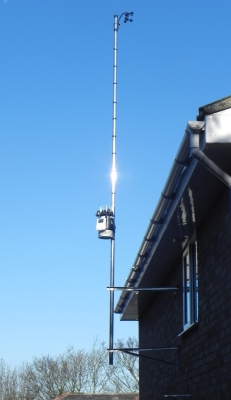
Santa came early this year with a new weather station. It's a Davis Vantage Pro 2 Plus the plus bit indicating that it has got two more sensors to measure solar radiation (sunshine) and UV (ultraviolet)
The kit has a more rugged and accurate rain gauge but the real selling point is that the anemometer can be erected at a distance from the rest of the sensors. The pictures below show "what's in the box" and the high tech testbed installation.
With the anemometer distant from the rain gauge I should not get the spurious rain readings mentioned in news below.
If you click here Station under test you can see readings from the new unit. Rain, temperature, humidity, solar and UV should be pretty accurate but the wind readings will be very low in its sheltered conditions. I plan to erect the new station in the new year when I can round up sufficient ladder holders and climbers.
Raspberry Pi has moved Ryzc, November 24 2015
Not very far - Just upstairs. You may have been following the toaster/UPS story below. There is a problem with my downstairs electrical ring main which occasionally trips the circuit board cutting off the power to downstairs and in particular to the Raspberry Pi. This came to a head in September 2015 when the power dropped off when I was away on holiday and the Pi was down until I got back to find that the Pi had got its memory corrupted and had to be rebuilt. Various items have been blamed for the electricity failure including the toaster, kettle and table lamp but all plead not guilty. Many electrician hours have been spent in testing everything and head scratching but no fault has ever been found. So I decided to move the Pi upstairs onto a different circuit. Well not so much move it as buy a new one with sufficient USB ports to add a wi-fi dongle as the existing one is cabled to the router next to it. I now have a latest model Pi with wi-fi dongle and 8GB memory stick which acts as data backup. I've just plucked up courage today to turn off the old Pi and move the data upstairs to the new one. So far so good ......
Rain Data Corrected Ryzc, November 23 2015
Phantom rain for November 15 and 17 has been removed. Management is looking for a less shaky mounting pole
Rain Data Alert 17 Nov 2015! Ryzc, November 18 2015
The rain readings for November 17th are wrong. It looks like the very high winds we are having today are shaking the Davis unit violently, rattling the rain recording cup and making it look like an Ark will soon be needed. Head scratching going on. If the wind gusts are in the 30mph region have a glance at the humidity reading, if this is not 90%+ then the odds are the rain reading is wonky
Toaster wins hands down Richie, February 8th 2015
The batteries lasted 20 days before they went flat. A test of the UPS by pulling out the power lead crashed the Pi. We admit defeat and will try to get our money back
UPS News Richie, January 20th 2015
The supplier sent a replacement UPS. The Pi skated through a toaster induced crash and also an investigation into using a plug mounted earth leakage trip (The main circuit board trips before the plug mounted one). How long will the batteries last?
Toaster fights back Richie, December 11th 2014
UPS was a dead loss - back-up AA batteries went flat within a week. After some to-ing and fro-ing the supplier is sending a replacement. Watch this space
It's all visual Nick, November 25th 2014
Weewx + matplotlib = a great way for visualising all your weather archive data. I've written a few rough and ready python scripts for doing this which you can find on GitHub.
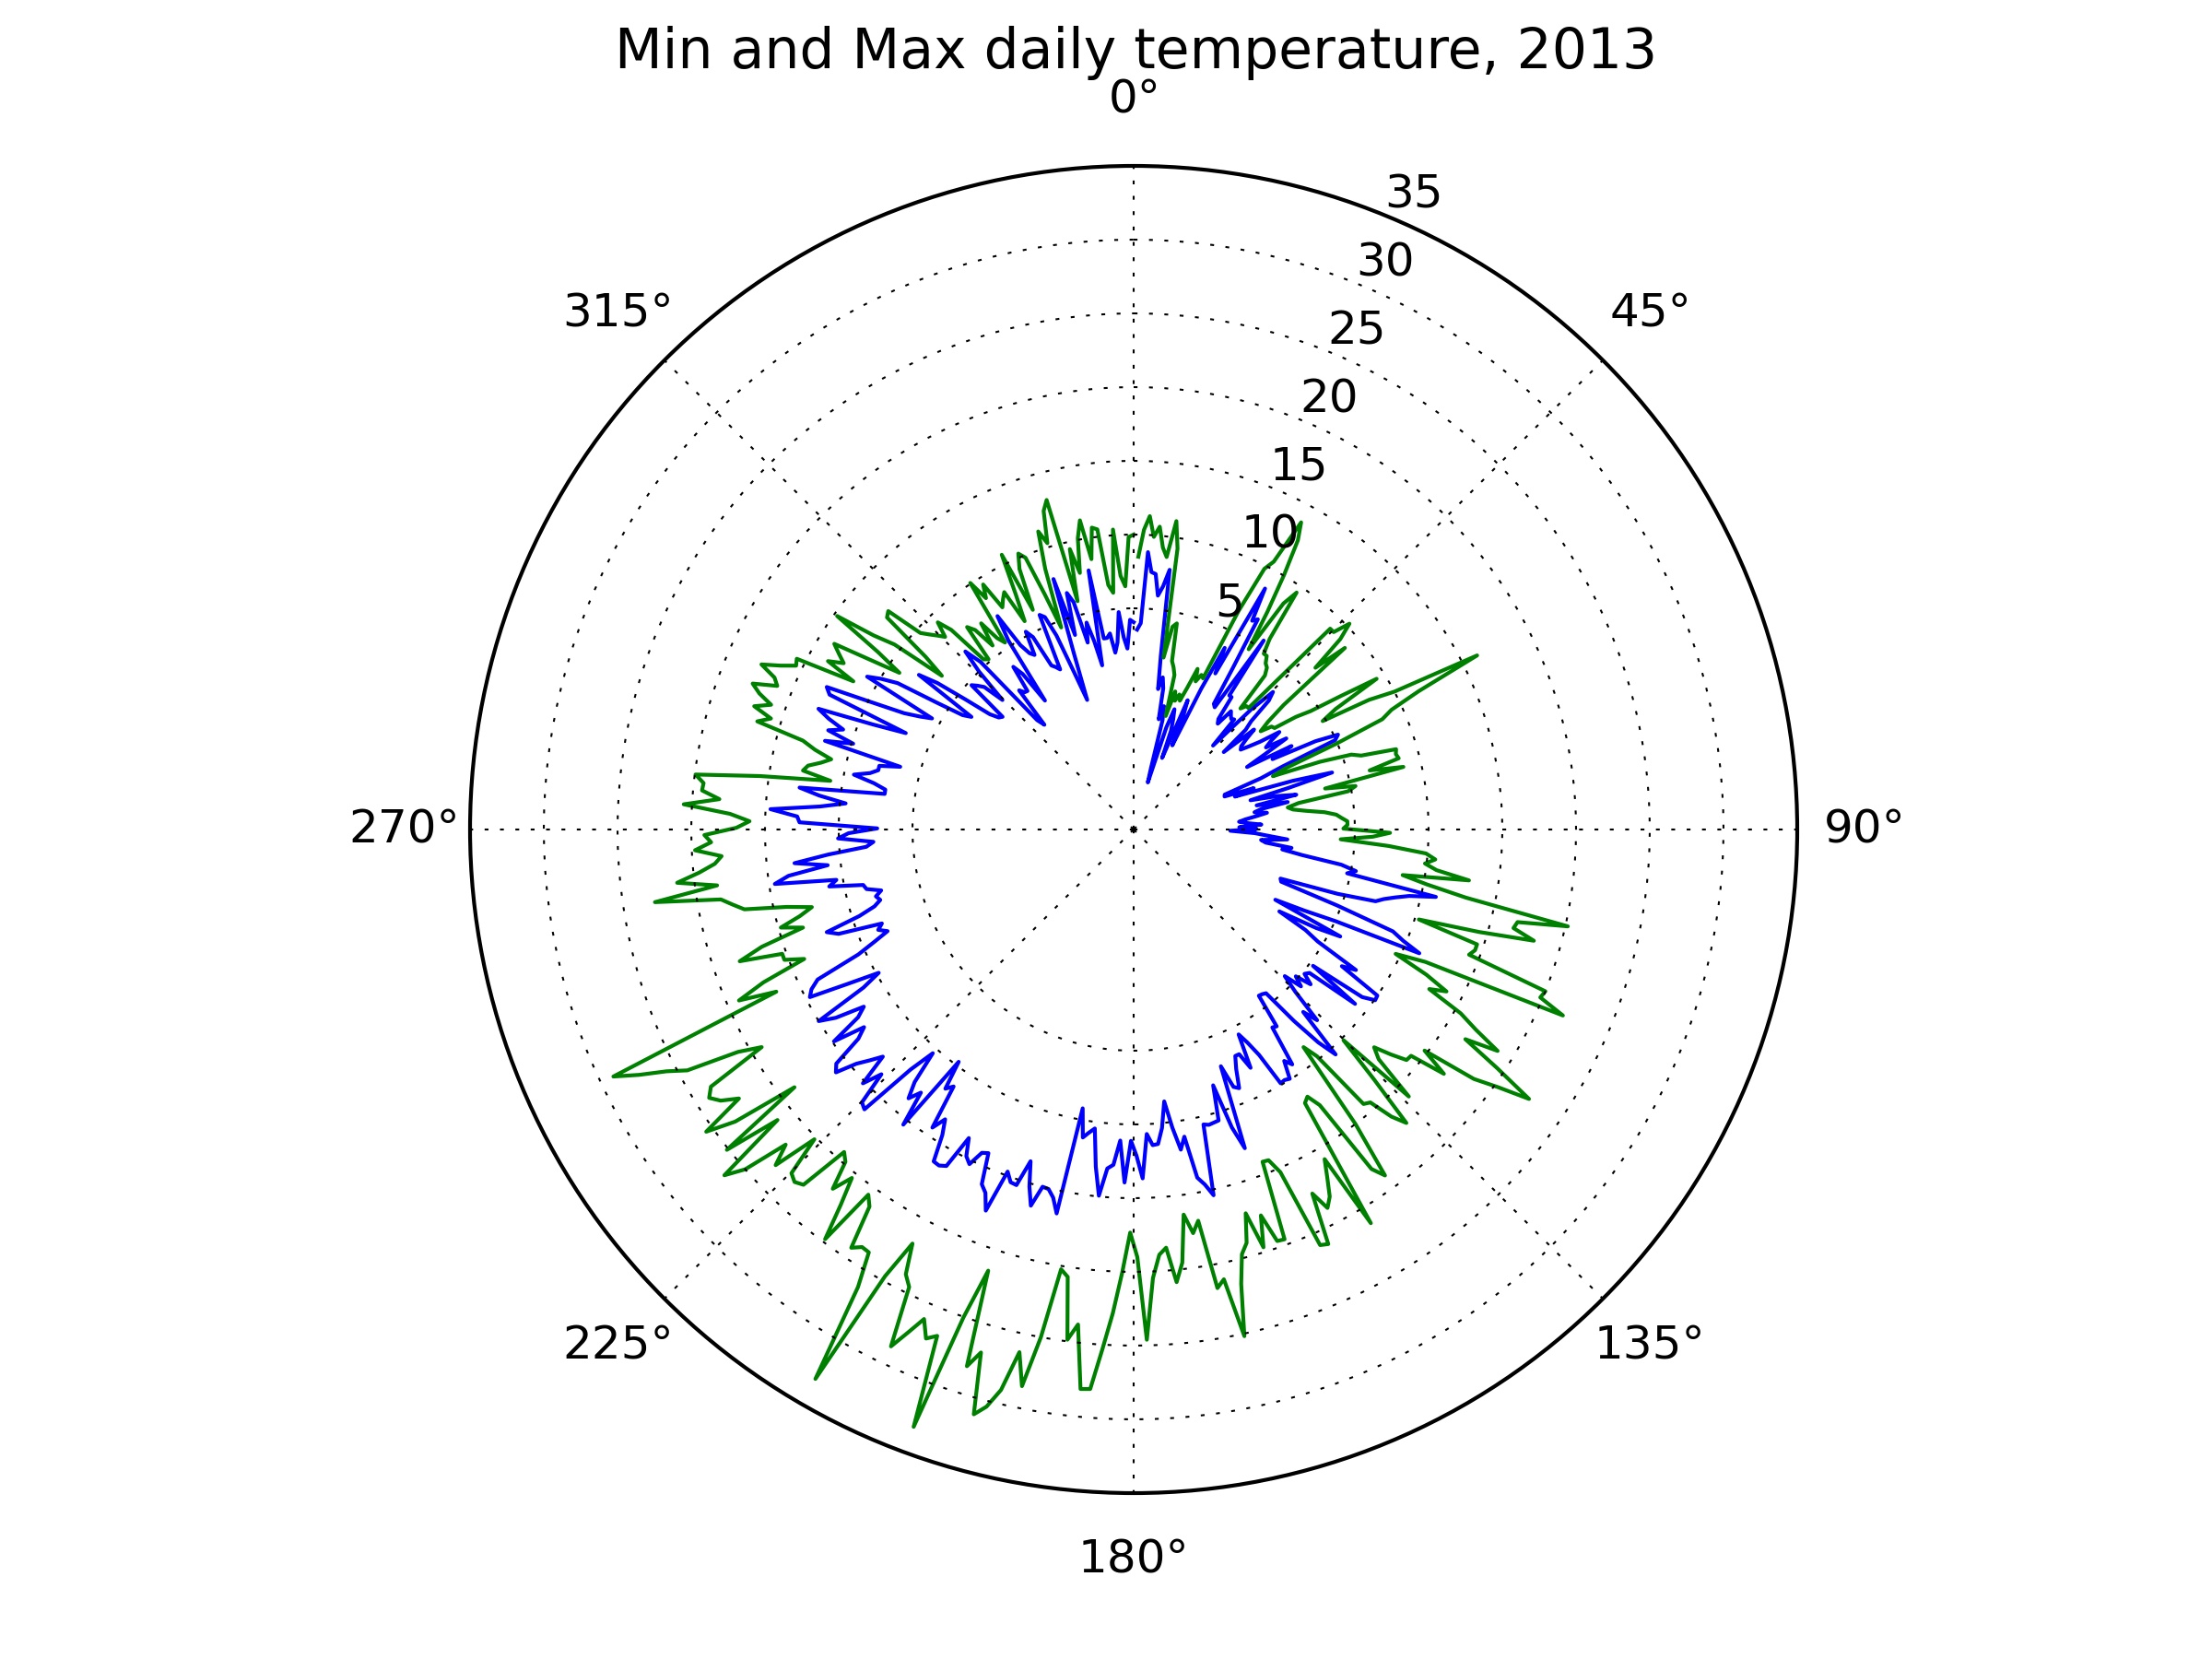
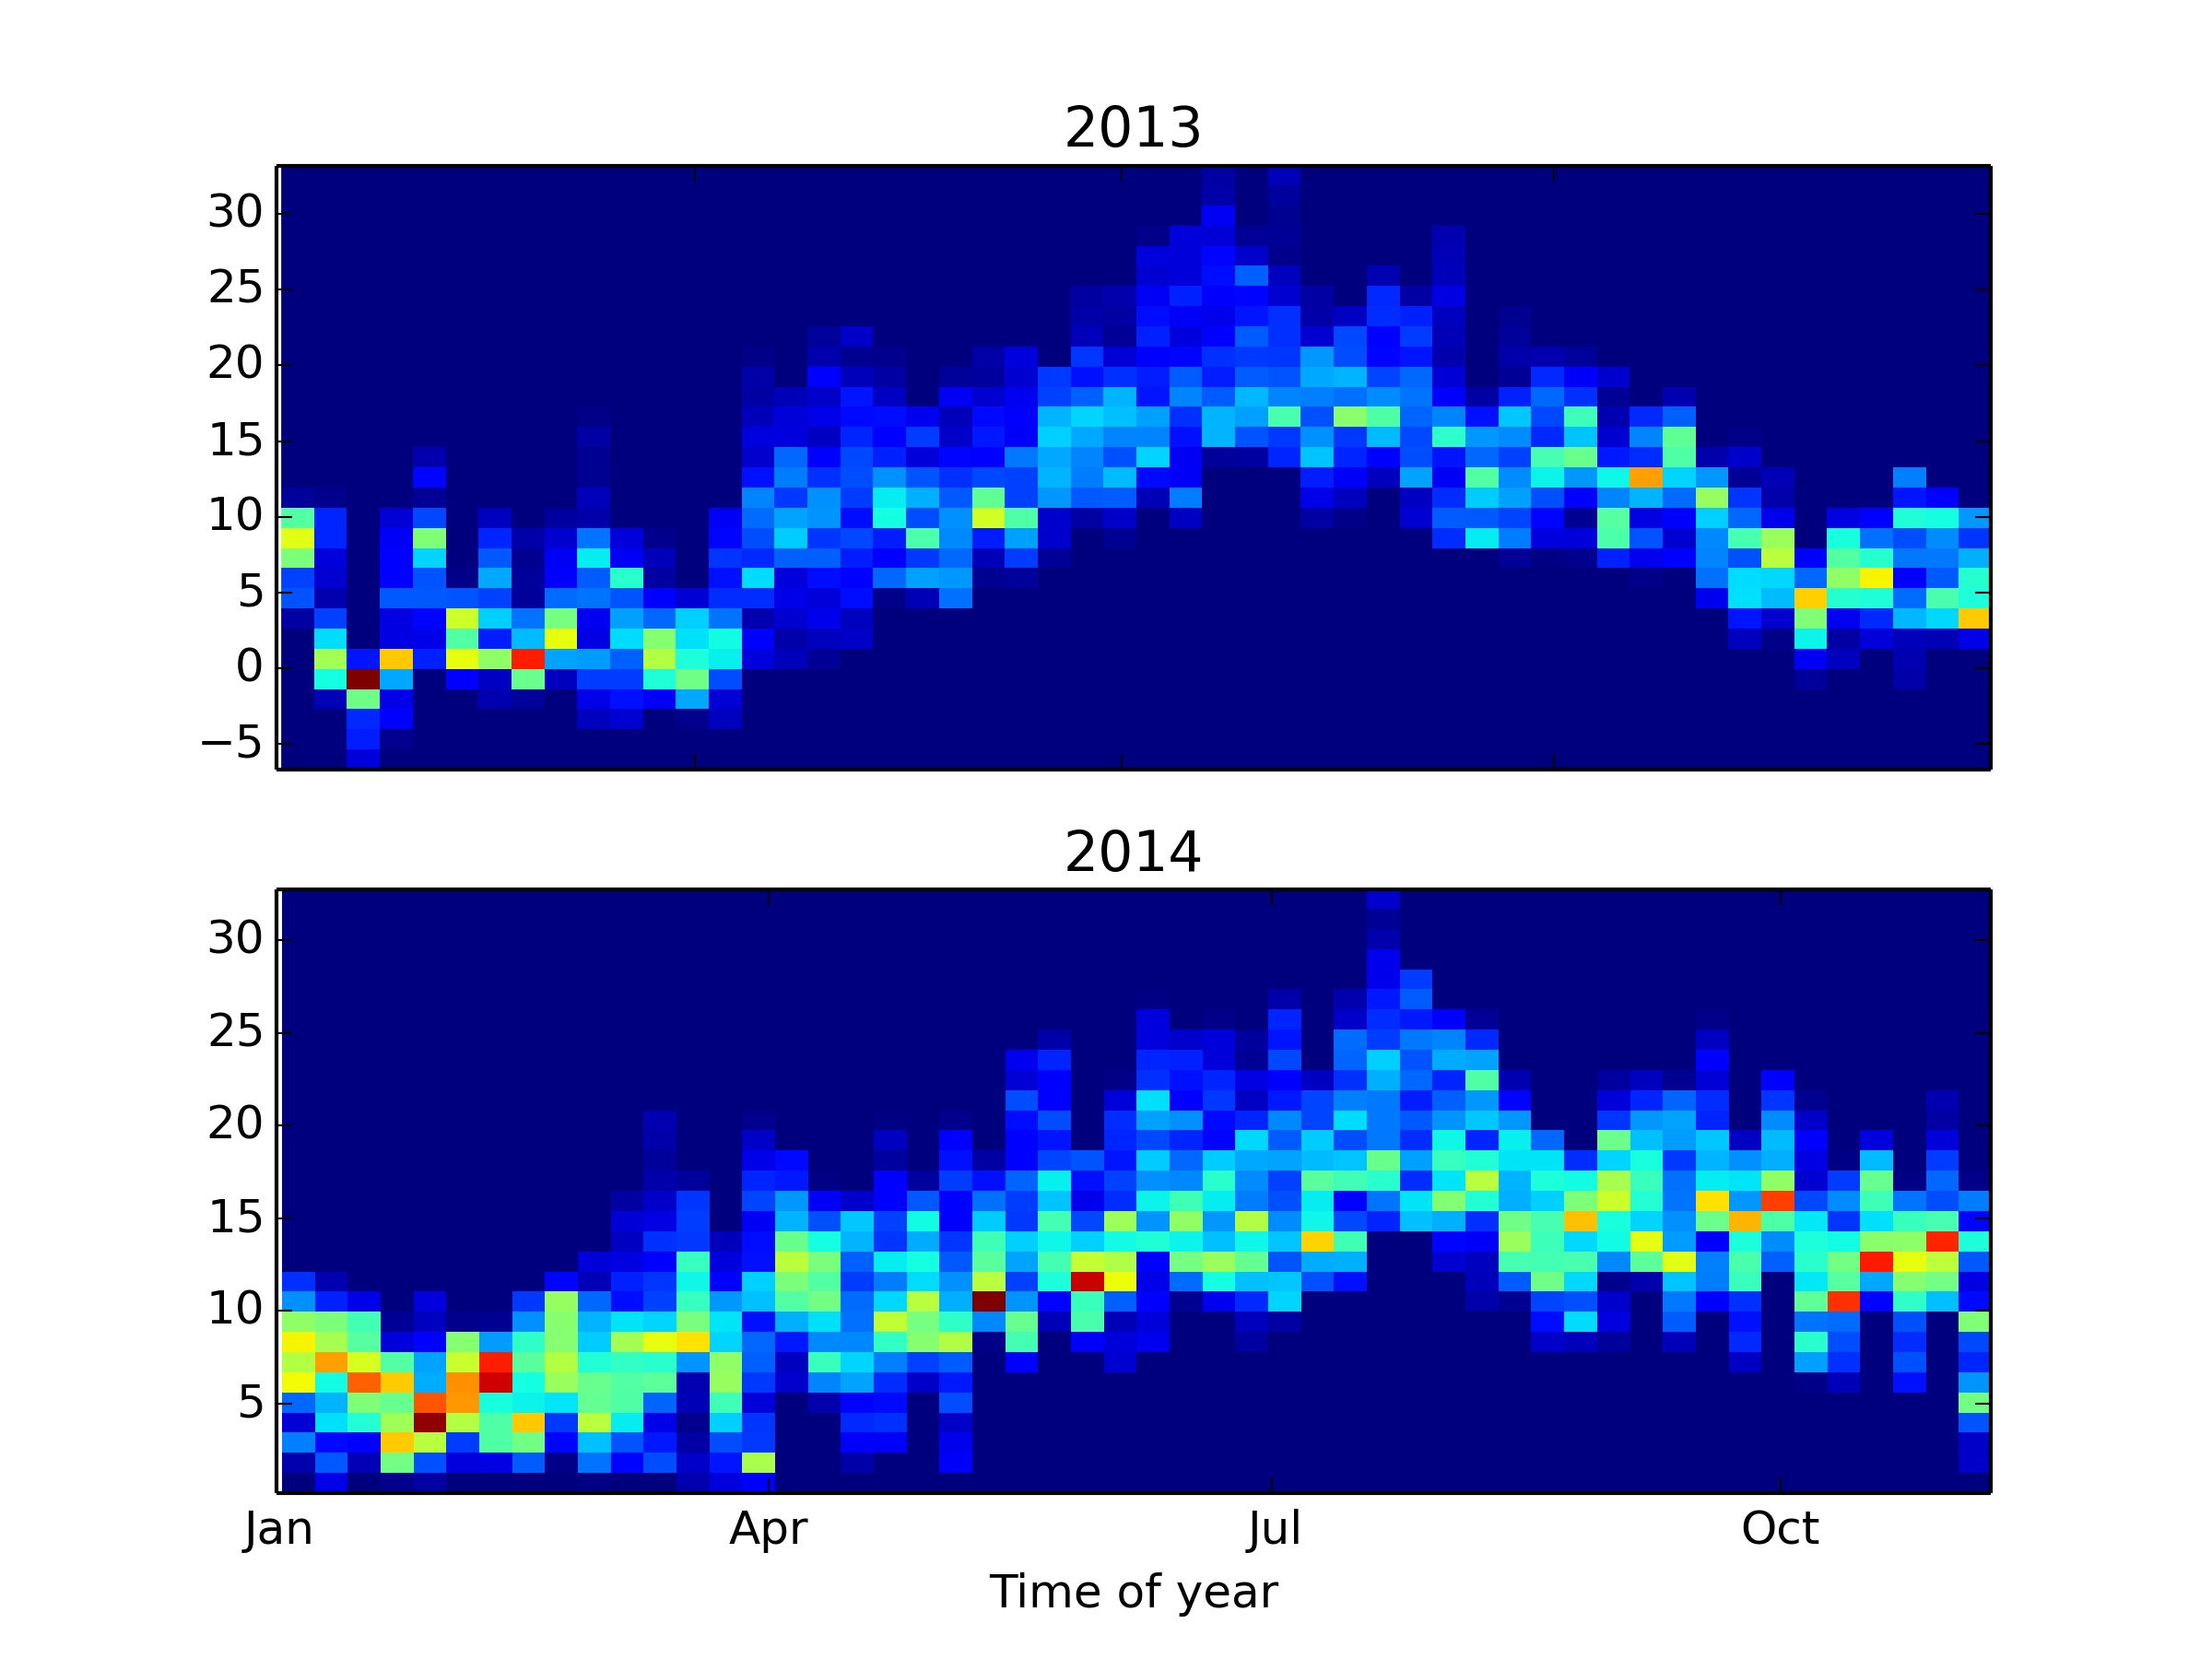
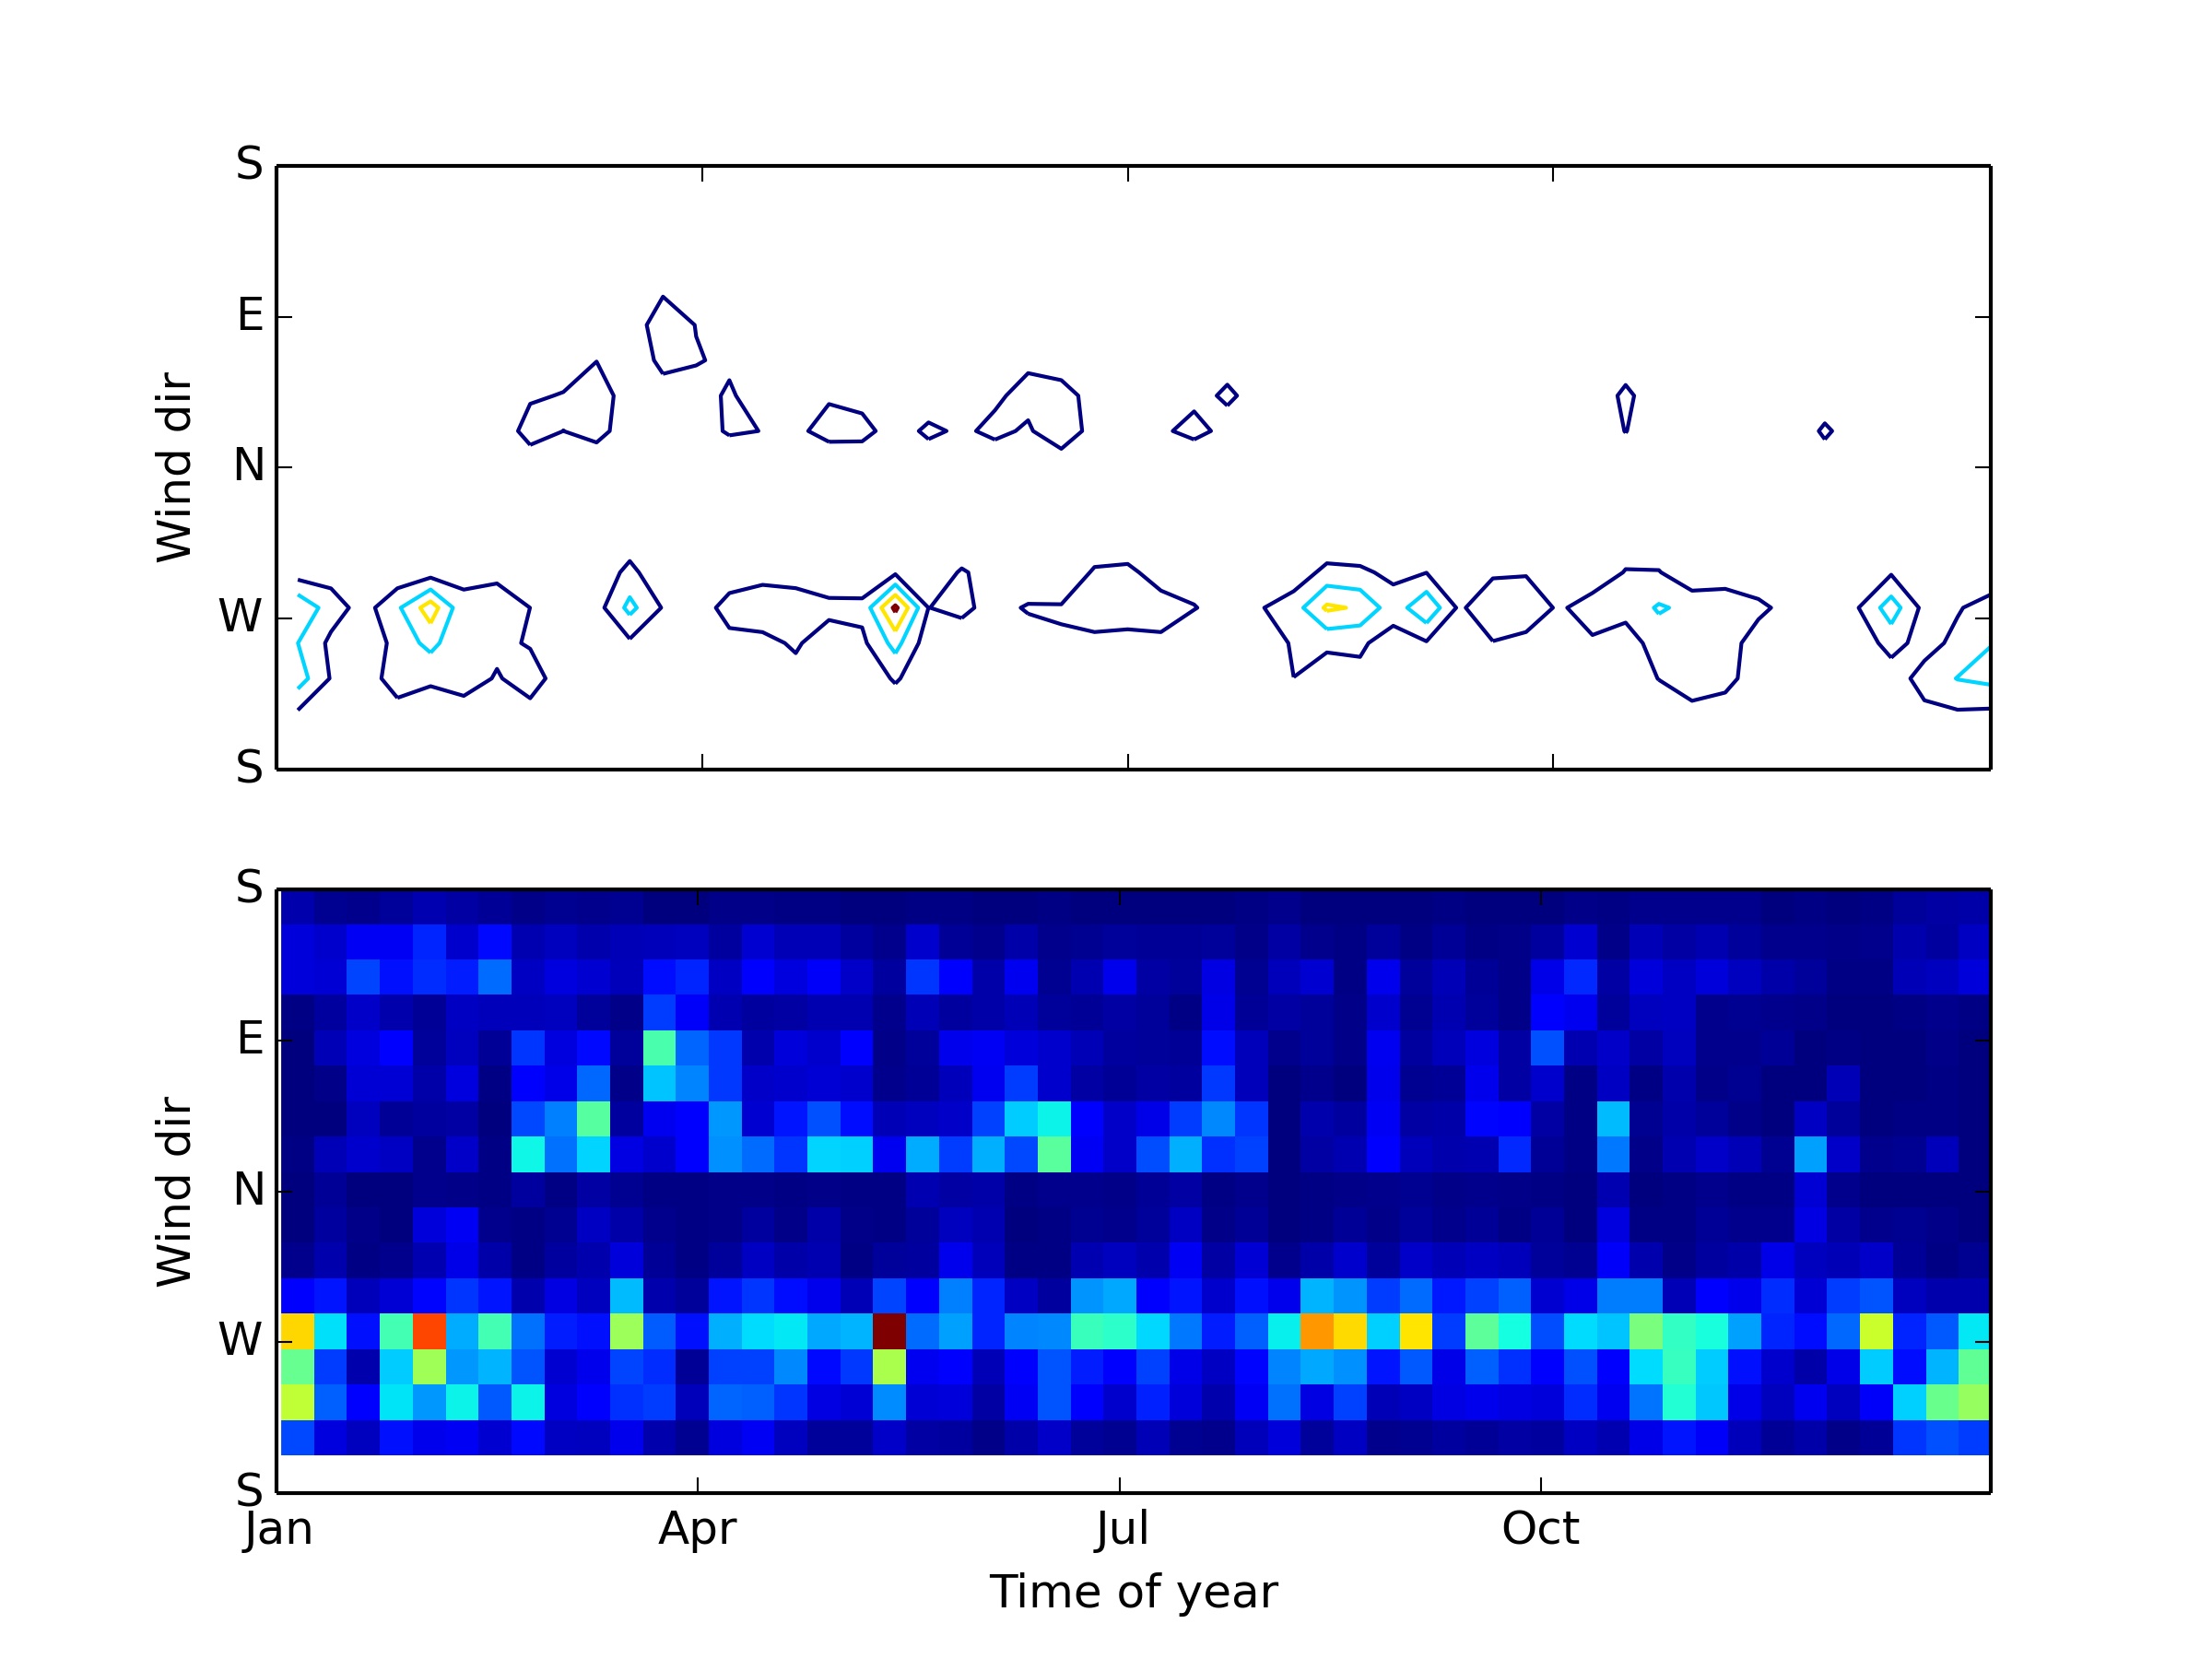
Click on the images to see the full size plots.
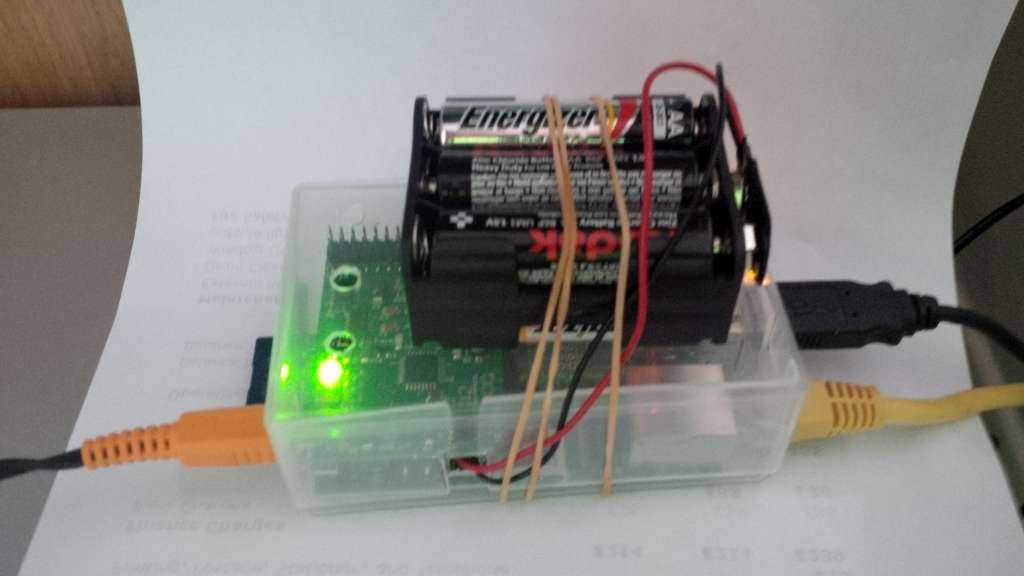
Pi 1-0 Toaster Richie, November 12th 2014
I finally got fed up with the battle with the toaster - see below - and decided to do something about it. The answer to my problems is (hopefully) an uninteruptable power supply and after some searching I found a UPS from a German Company. It is a circuit board which sits on top of the Pi and is connected to collection of AA batteries:
Time Change Confusion Richie, April 3rd 2014
The spring time change confused the system. It didn't stop working but decided it liked the data for 2am Sunday March 30th so much that it would keep on publishing it. Guru Nak applied a dose of salts clearing the blockage and now all is well again
Some minor twiddling with the graphs Ricardo, March 14th 2014
One of the graphs on this site has always annoyed me - the temperature one on the Year summary page. It has always shown the average temperature for each day of the year and I'm sometimes not sure what averages bring to the discussion. Did you know that men in the UK have on average 1.96 legs. Anyway I've changed it to give the high and low temperature on each day. When I say "I've changed it" I mean I had a good hack and then called the Pi guru Nak. I wasn't helped by there being a typo in the manual and the fact that the # sign in Python means ignore this line whereas in html it means this is a sign. If you have any thoughts on the matter send me an email: general@dajda.net.
Warm Start to the year Richie, January 3rd 2014
If you are reading this at the start of 2014 it looks like it was unseasonably warm on January 2nd. This was the day for annual maintenance and a peer at the ISS (Integrated Sensor Suite or thing on the end of the pole on my roof). The rain readings have been looking low for the last couple of months but nothing obviously wrong with the rain bucket. A bit of a wash and brush up has made it a bit more responsive. And the reason for the hot weather? - An hour in my kitchen doing the clean-up. The Pi guru has been asked to edit the Pi weather database
Toasters don't like the Pi Richie, November 17th, 2013
My toaster took a dislike to something and blew a fuse - trouble is my Raspberry Pi is on the same circuit and lost power. Anyone know a good UPS for a Pi?
We've made the local news Richie, November 3rd, 2013
The highest windspeed measured by the weather station this year has been cited by the local press. It was 39 mph which hit Royston on October 28th at 7:25 am.
Check it out on the Royston Crow website: Storm St Jude sees Royston hit by winds of 39mph.
And on the Weekly News site: St Jude storm update: Travel chaos, fallen trees and serious injuries in Melbourn.
Weather Underground meet-up Richie, October 15th, 2013
Yours truly was lucky enough to be invited to the first UK meet-up run by Weather Underground last week.
Having been bought by The Weather Channel,, they were eager to meet some weather enthusiasts who contribute readings to their website to hear their views. The meeting in London was the first stop in their trip, followed by Germany where they also have a large number of contributors. They spoke of the mobile apps they are developing and the overhaul of their website
There was great interest from weather station owners in the use of the Raspberry Pi and Weewx to publish weather data.
Check out the goodies they gave us.